Lucky Block Price Prediction: LBLOCK/USD Resumes Consolidation Above 0.000100
Estimated Reading Time: 3 minutes
Don’t invest unless you’re prepared to lose all the money you invest. This is a high-risk investment and you are unlikely to be protected if something goes wrong. Take 2 minutes to learn more
Lucky Block Price Prediction – September 14
The Lucky Block price prediction shows that LBLOCK is trading at $0.000095 as the coin seems to be preparing for a bullish movement.
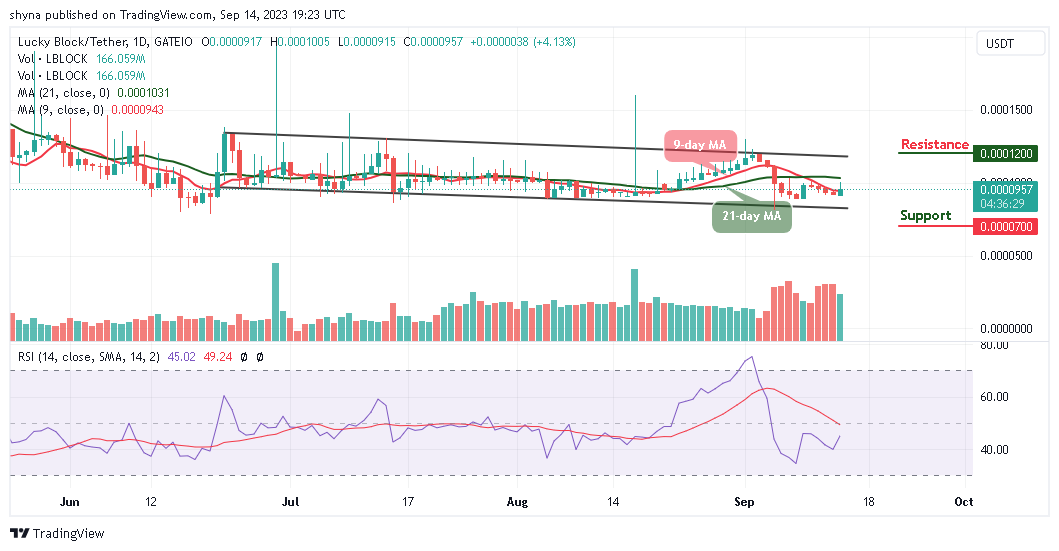
LBLOCK/USD Long-term Trend: Bullish (Daily Chart)
Key levels:
Resistance Levels: $0.000120, $0.000130, $0.000140
Support Levels: $0.000070, $0.000060, $0.000050
At the time of writing, LBLOCK/USD seems to be waiting for an opportunity for a break into the positive side. The crypto is trading above the 9-day moving average to touch the daily high at $0.000100. However, the Lucky Block price will extend toward the resistance level of $0.000110 if the buyers increase the pressure.
Lucky Block Price Prediction: Is $0.000110 Resistance Coming for LBLOCK?
It is likely for the Lucky Block price to touch the resistance level of $0.000110 as the market price heads toward the north. Any further bullish movement above the upper boundary of the channel may locate the potential resistance levels at $0.000120, $0.000130, and $0.000140. Meanwhile, when the new uptrends are gathering, traders could use the 9-day moving average as a pivot resistance point to gauge the strength of the trend.
On the contrary, if the LBLOCK price fails to move up; traders may see a price cut toward the south, and a further low could bring the price to the support levels at $0.000070, $0.000060, and $0.000050 respectively. For now, the Lucky Block price will continue to rise as the technical indicator Relative Strength Index (14) moves to cross above the 50-level.
LBLOCK/USD Medium-term Trend: Ranging (4H Chart)
According to the 4-hour chart, the Lucky Block price is moving bullishly as the coin trades at $0.00095. However, the Lucky Block will spike above the upper boundary of the channel, if not, the support level of $0.000082 and below may come into focus.
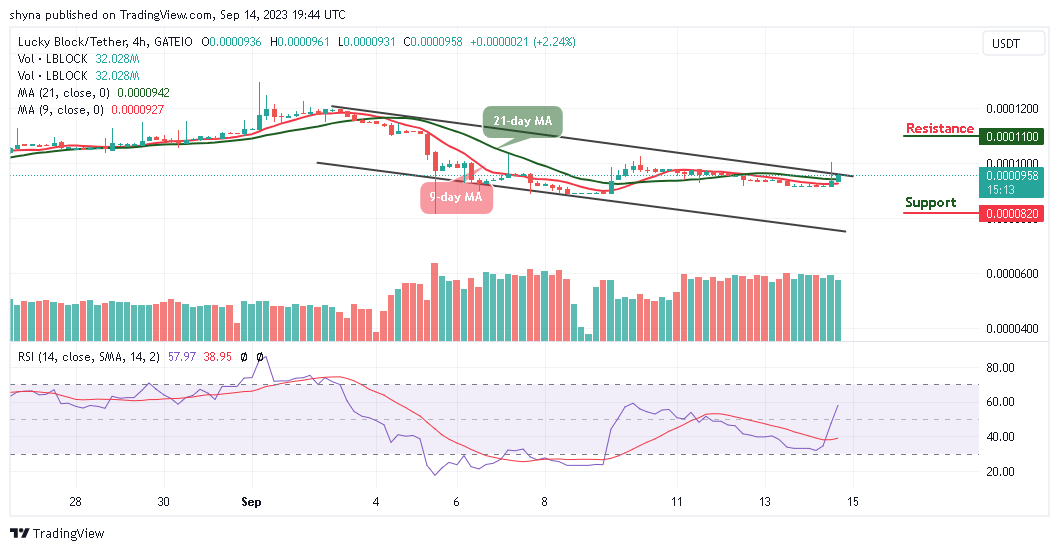
Nonetheless, if the bulls push the market price to hit the resistance level of $0.000105, traders may expect the coin to spike above the upper boundary of the channel, breaking this barrier could push the price toward the resistance level of $0.000100 and above while the technical indicator Relative Strength Index (14) moves to cross above the 60-level, suggesting a bullish signal.
You can purchase Lucky Block here. Buy LBLOCK