Polkadot (DOT) Battles the $40 Resistance, Eyes the $58 High
Estimated Reading Time: 2 minutes
Don’t invest unless you’re prepared to lose all the money you invest. This is a high-risk investment and you are unlikely to be protected if something goes wrong. Take 2 minutes to learn more
Polkadot (DOT) Long-Term Analysis: Bullish
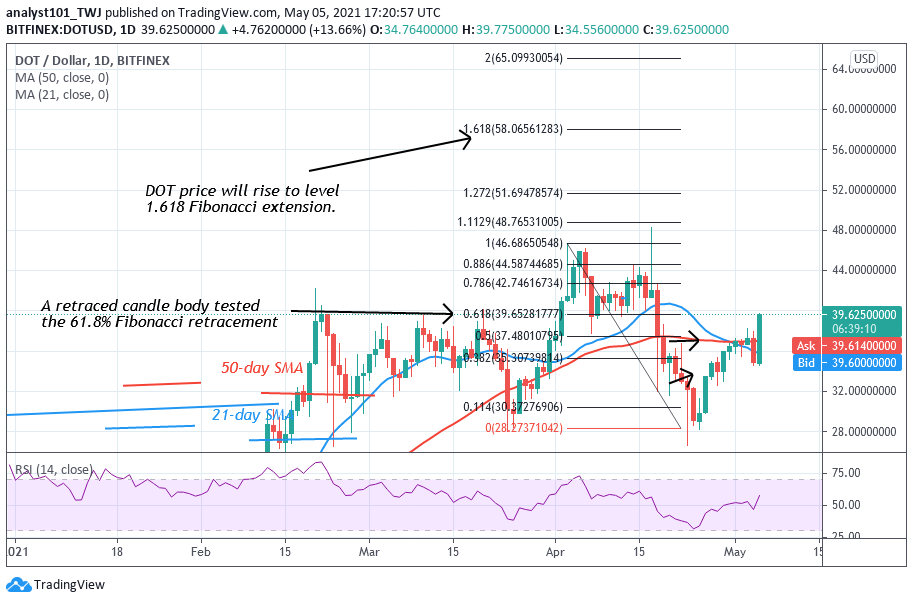
Since April 25, DOT price has been in an upward move from the low of $28. The altcoin has risen above $39 but it is finding penetration difficulty at the $40 resistance zone. If buyers clear the current resistance levels, the market will rise and retest the $46 overhead resistance. Meanwhile, the Fibonacci tool has indicated an upward movement of the coin. On April 3 uptrend, a retraced candle body tested the 61.8% Fibonacci retracement. This indicates that DOT price will rise to level 1.618 Fibonacci extension or the high of $58.06.
Polkadot (DOT) Indicator Analysis
DOT price is at level 56 of the Relative Strength Index period 14. It indicates that the market is in an uptrend zone above the centerline 50. The 21-day and 50-day SMAs are sloping upward indicating the previous uptrend.
Technical indicators:
Major Resistance Levels – $48, $52, $56
Major Support Levels – $32, $28, $24
What Is the Next Direction for Polkadot (DOT)?
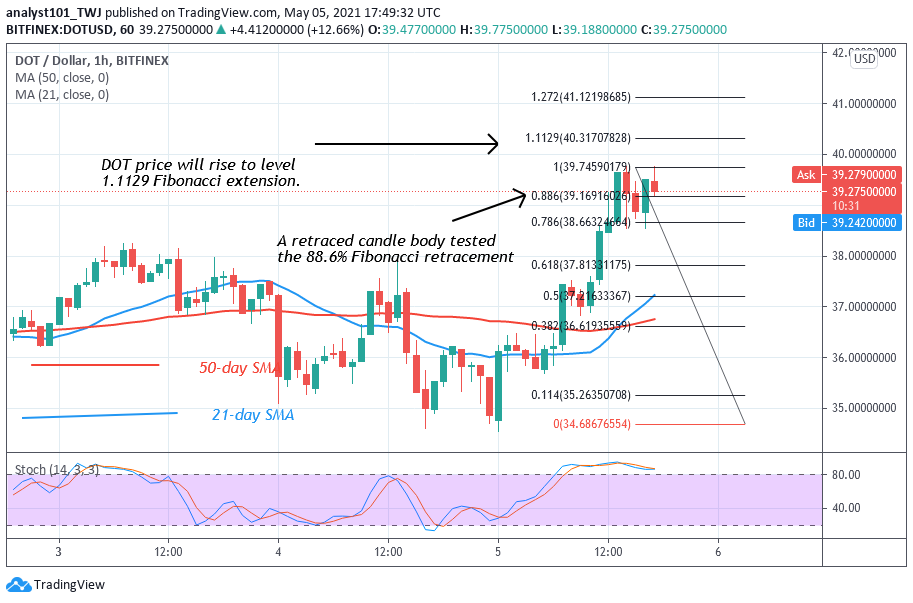
On the 4 hour chart, DOT price is making a series of higher highs and higher lows. The altcoin has risen to the $40 resistance zone but it is falling after two rejections. On May 5 uptrend, a retraced candle body tested the 88.6% Fibonacci retracement The retracement indicates that DOT price will rise to level 1.1129 Fibonacci extension.
Note: cryptosignals.org is not a financial advisor. Do your research before investing your funds in any financial asset or presented product or event. We are not responsible for your investing results