Polkadot (DOT) Retraces to $24 Low, Resumes Up Trending
Estimated Reading Time: 2 minutes
Don’t invest unless you’re prepared to lose all the money you invest. This is a high-risk investment and you are unlikely to be protected if something goes wrong. Take 2 minutes to learn more
Polkadot (DOT) Long-Term Analysis: Bullish
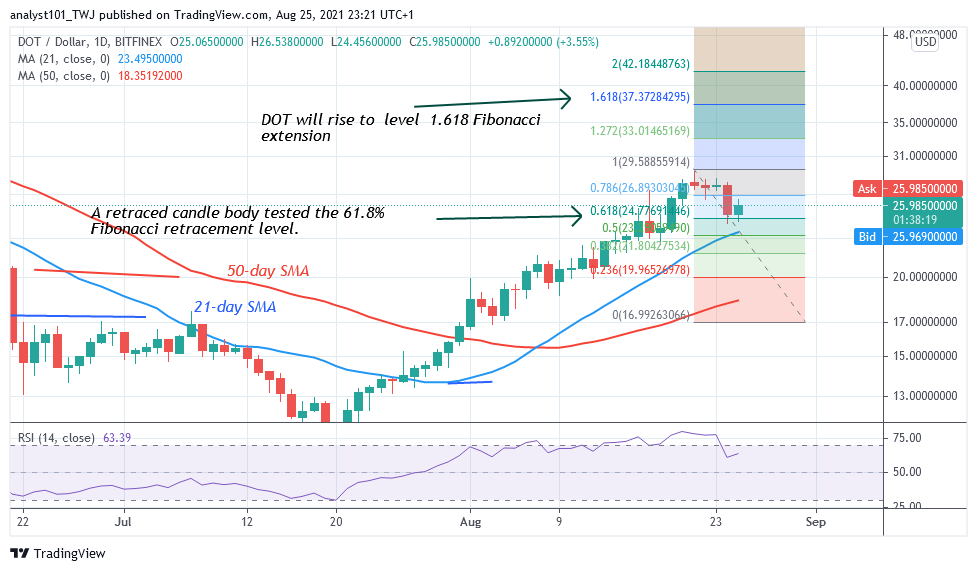
For the past five days, Polkadot’s (DOT) has been in a downward move as the altcoin fell to the low of $24.34. Today, bullish candlesticks are indicating that the bearish trend has been terminated. The crypto is rising on the upside to retest or break the $29.35 resistance level. Meanwhile, on August 21 uptrend; a retraced candle body tested the 61.8% Fibonacci retracement level. The retracement indicates that the DOT price will rise but reverse to1.618 Fibonacci extension or level $37.37.
Polkadot (DOT) Indicator Analysis
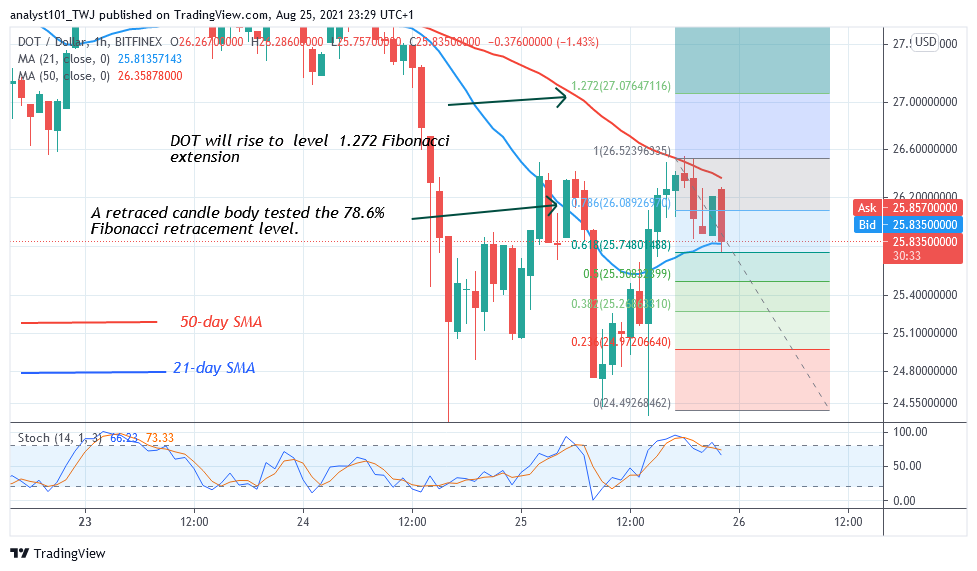
DOT price is at level 63 of the Relative Strength Index period 14. It indicates that Polkadot is in the bullish trend zone and capable of rising on the upside. . The 21-day and 50-day SMA are sloping upward indicating the previous trend. The altcoin is below the 80% range of the daily stochastic. The crypto is retracing from the $26.50 high. It indicates that the market is in a bearish momentum.
Technical indicators:
Major Resistance Levels – $48, $52, $56
Major Support Levels – $32, $28, $24
What Is the Next Direction for Polkadot (DOT)?
Polkadot’s price was earlier in a downward move. DOT price fell to $24.70 low as bulls bought the dips. The selling pressure has been exhausted as the market moves up. Meanwhile, on August 25 uptrend; a retraced candle body tested the 78.6% Fibonacci retracement level. The retracement indicates that the DOT price will rise but reverse at level 1.272 Fibonacci extension or level $27.07.
You can purchase crypto coins here. Buy Tokens
Note: Cryptosignals.org is not a financial advisor. Do your research before investing your funds in any financial asset or presented product or event. We are not responsible for your investing result