Polkadot Reaches Bearish Exhaustion as It Hovers Above $7.18
Estimated Reading Time: 2 minutes
Don’t invest unless you’re prepared to lose all the money you invest. This is a high-risk investment and you are unlikely to be protected if something goes wrong. Take 2 minutes to learn more

Free Crypto Signals Channel
Polkadot (DOT) Long-Term Analysis: Bearish
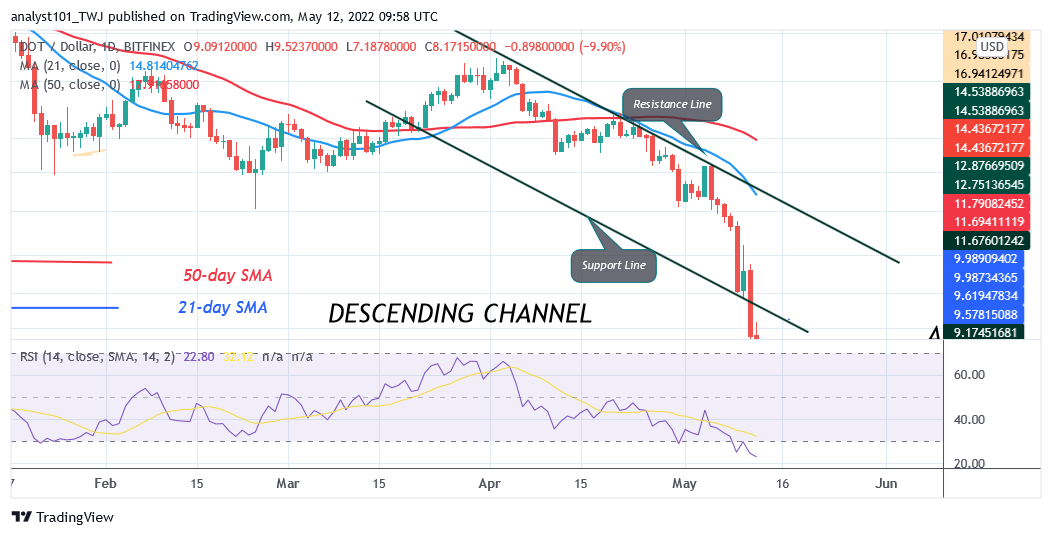
Today, Polkadot’s (DOT) price has declined to a low of $7.18 as it hovers above $7.18. The cryptocurrency is deeply in the oversold region. Today, the candlestick is displaying a long tail pointing to the current support. The candlestick long tail is describing that the current support has strong buying pressure. However, if the current support holds, Polkadot will commence the resumption of an upward move. The selling pressure will resume if the bears break below the current support.
Polkadot (DOT) Indicator Analysis
DOT price is at level 23 of the Relative Strength Index for period 14. The altcoin is trading in the oversold of the market. The current downtrend is likely to subside. The crypto has a bearish crossover. That is 21-day line SMA crosses below the 50-day line SMA indicating a sell order. The altcoin is below the 20% range of the daily stochastic. It indicates that the market has reached oversold region. Buyers will emerge to take control of prices. The 50-day line SMA and the 21-day line SMA are sloping downward indicating the downtrend.
Technical indicators:
Major Resistance Levels – $48, $52, $56
Major Support Levels – $32, $28, $24
What Is the Next Direction for Polkadot (DOT)?
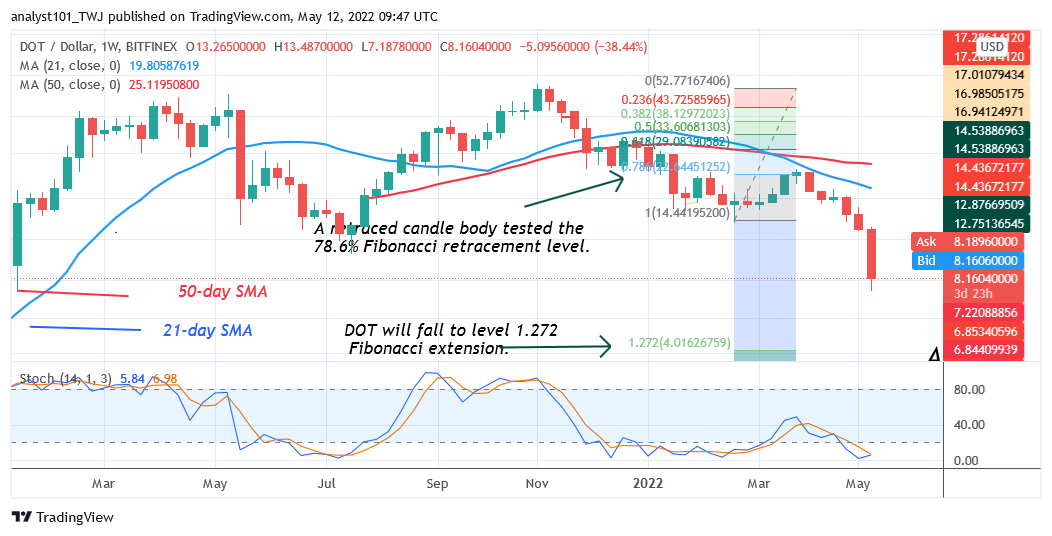
DOT/USD has fallen to the bottom of the chart as it hovers above $7.18. The Fibonacci tool has indicated a further downward movement of the coin. Meanwhile, on the weekly chart, a retraced candle body tested the 78.6% Fibonacci retracement level on March 28. The retracement suggests that DOT price will fall to level 1.272 Fibonacci extension or level $4.06. From the price action, the DOT price is approaching the level 1.272 Fibonacci extension .
You can purchase crypto coins here. Buy LBlock
Note: Cryptosignals.org is not a 1a financial advisor. Do your research before investing your funds in any financial asset or presented product or event. We are not responsible for your investing results