Polkadot Reaches Oversold Region at $19.47 as Altcoin Resumes Upward
Estimated Reading Time: 2 minutes
Don’t invest unless you’re prepared to lose all the money you invest. This is a high-risk investment and you are unlikely to be protected if something goes wrong. Take 2 minutes to learn more

Free Crypto Signals Channel

Polkadot (DOT) Long-Term Analysis: Bearish
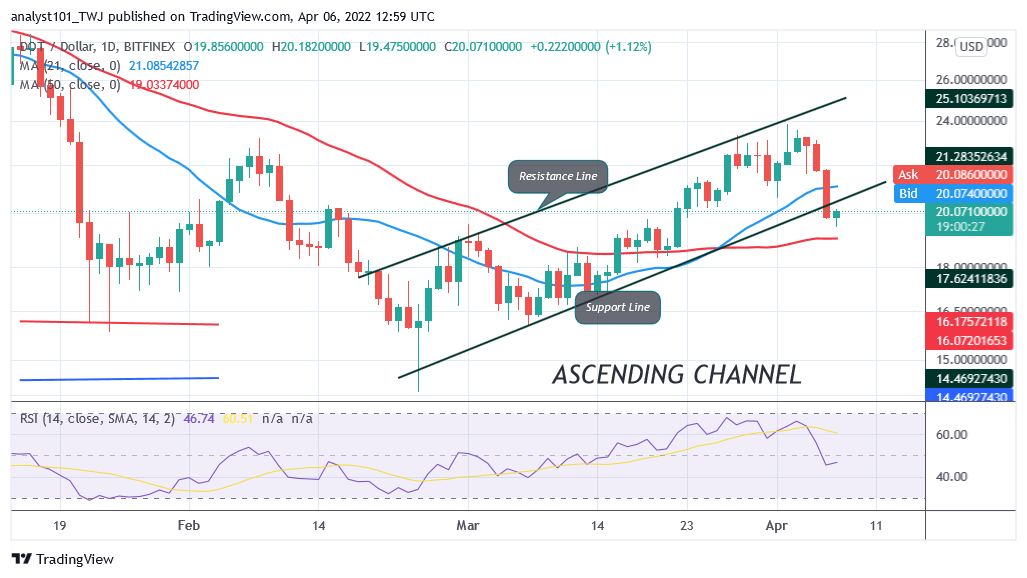
Polkadot’s (DOT) price has fallen to $19 low after rejection at the $24 resistance zone as altcoin resumes upward. Since March 28, the Polkadot has been facing rejection at the $23.34 and $23.83 resistance zones. Buyers have failed to keep the price above the $23 high. On April 4, the DOT price was repelled as the altcoin fell below the 21-day line moving average. The cryptocurrency is now trading between 21-day SMA and 50-day SMA indicating that the altcoin will resume a range-bound between the moving averages. Polkadot will trend again when the moving average lines are breached.
Polkadot (DOT) Indicator Analysis
DOT price has fallen to level 46 of the Relative Strength Index for period 14. The crypto is now in the downtrend zone and capable of a further downward move. DOT’s price is between the moving averages indicating a possible sideways move of the cryptocurrency. The 50-day line SMA and the 21-day line SMA are sloping upward indicating the uptrend. The altcoin is below the 20% range of the daily stochastic. The altcoin has reached the oversold region of the market. Buyers will emerge in the oversold region to push prices upward.
What Is the Next Direction for Polkadot (DOT)?
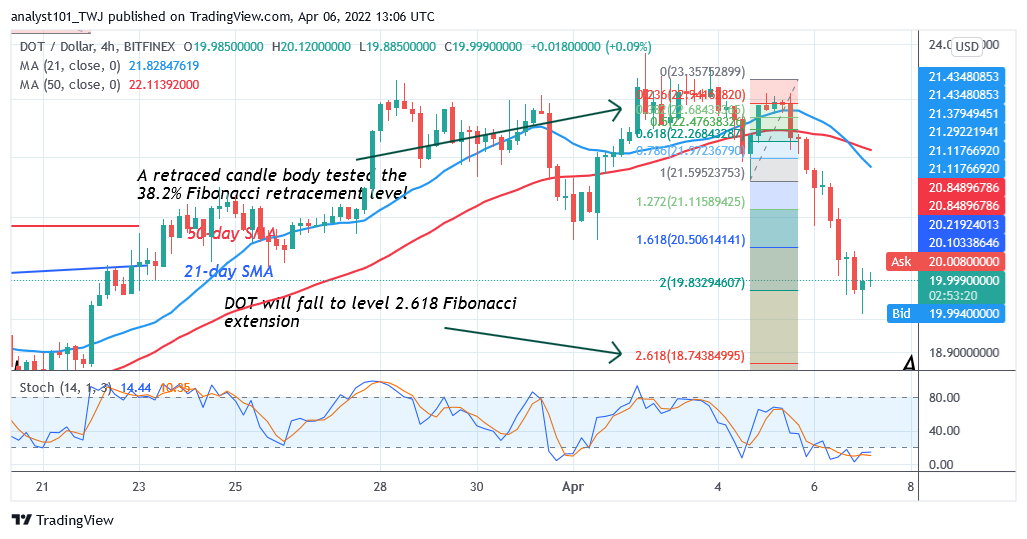
DOT/USD is in a downward move as price breaks below the moving averages as the altcoin resumes upward. The altcoin will further decline if the current support is breached. Meanwhile, on April 4 downtrend; a retraced candle body tested the 38.2% Fibonacci retracement level. The retracement suggests that DOT will fall to level 2.618 Fibonacci extension or level $18.74. From the price action, the market has reached the low of $19.47 and resumed upward.
You can purchase crypto coins here. Buy LBlock
Note: Cryptosignals.org is not a 1a financial advisor. Do your research before investing your funds in any financial asset or presented product or event. We are not responsible for your investing results