Polygon (MATIC/USD) Market Looms, Intending to Rally
Estimated Reading Time: 3 minutes
Don’t invest unless you’re prepared to lose all the money you invest. This is a high-risk investment and you are unlikely to be protected if something goes wrong. Take 2 minutes to learn more
Polygon Price Prediction – October 15
Over a couple of trading sessions for several weeks, the operation of the MATIC/USD currently looms around the point of $0.50, intending to rally from the value line.
The $0.50 trade point has been identified as the key area where bears should exercise caution while trying to push through certain underlying support values. Long-position holders should rather wake up to take advantage of any opportunity that is technically suitable from the current trading point of $0.516 in light of exercising a line of preventive actions regarding additional shorting of selling activities.
MATIC/USD Market
Key Levels:
Resistance levels: $0.60, $0.65, $0.70
Support levels: $0.45, $0.40, $0.35
MATIC/USD – Daily Chart
The MATIC/USD daily chart mirrors the crypto-economic market looming around the lower range line of $0.50, intending to rally from the axis of the value line.
Indicators of reading pace have basically pinpointed that range lines are positioned between $0.60 and $0.50, as the Bollinger Bands are marked at $0.579, $0.534, and $0.490. The stochastic oscillators have positioned themselves from 43.037 to 15.052 values. The positioning placement pattern of the oscillators currently portends that forces have been produced to the downside and have been reducing at a maximal capacity.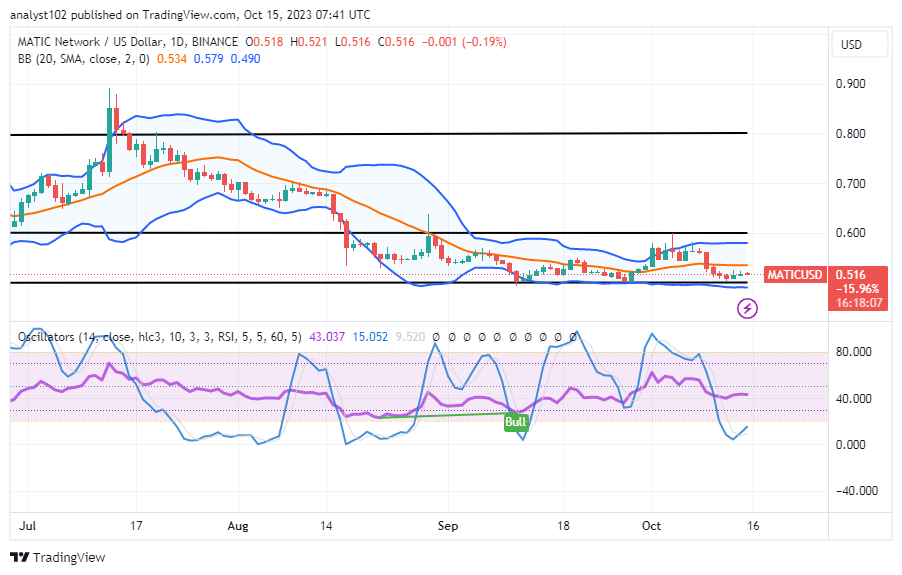
Will the MATIC/USD market remain stable below $0.50 following this point of trade at $0.516?
There might be a cause for creating more recuperation of rising forces around the point of $0.50 in the market operations of the MATIC/USD, given that the crypto-economic market looms around the point, intending to rally soon.
Sellers would have to sustain the price below the depression setting of the middle Bollinger Band at $0.534 in order to continue the current depreciation motion pace before moving in an extension to the upper part if they fail to push back from the previously mentioned spot.
Given the current situation, signs are generally indicating that long-position takers are better positioned to recoup positions from around the crucial $0.50 trade spot. Buyers should start placing orders from the position of the lower Bollinger Band trend line, as we are presently assuming.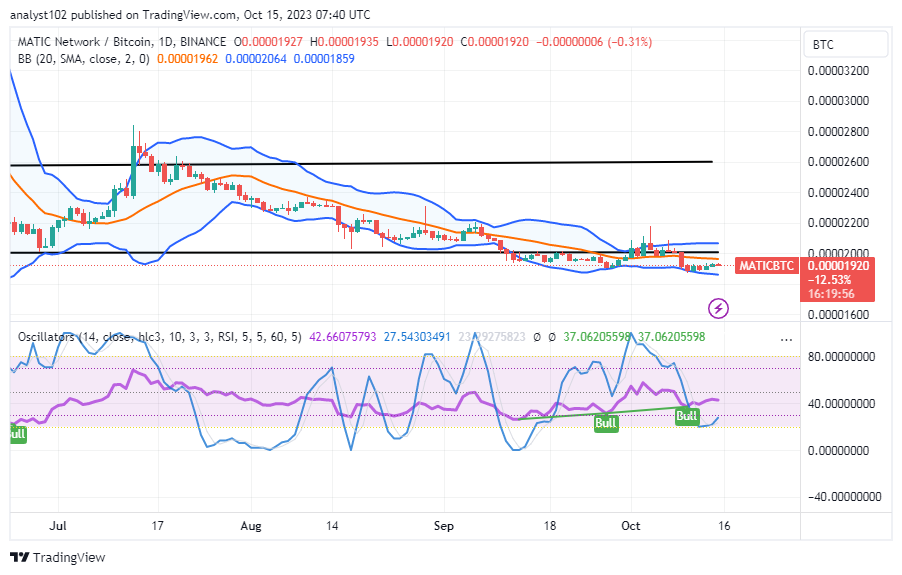
MATIC/BTC Price Analysis
In comparison, the Polygon market looms its positions at the lower trading trend line of the lower Bollinger Band against the standing value of Bitcoin, intending to rally.
The Bollinger Band trend lines have been systemically positioned eastward to mark logical points that the base crypto economy will keep toward securing rebounding points against its quotient crypto instrument. From the oversold area, the stochastic oscillators have curved slightly to the north. In order to take advantage of the current price before subsequent volatility changes, buyers must maintain their position.
Note: Cryptosignals.org is not a financial advisor. Do your research before investing your funds in any financial asset or presented product or event. We are not responsible for your investing results.
You can purchase Lucky Block here. Buy LBLOCK