Polygon (MATIC/USD) Price Holds in Ranges, Rising Lesser
Estimated Reading Time: 3 minutes
Don’t invest unless you’re prepared to lose all the money you invest. This is a high-risk investment and you are unlikely to be protected if something goes wrong. Take 2 minutes to learn more
Polygon Price Prediction – October 9
Price actions mark the activities of ups and downs in the transaction lines involving the use of Polygon versus the US coin, given that the crypto-economic price holds in ranges, rising less toward the resistance point of $0.60.
Long-term sessions show that the lower range trade value, which is recorded at $0.50, is the crucial support for rebounding entry. At the time of writing this technical article, there is a minor movement that suggests a sell-off. That suggests that trading activities will likely continue for a while before taking a clear course in the future.
MATIC/USD Market
Key Levels:
Resistance levels: $0.60, $0.65, $0.70
Support levels: $0.50, $0.45, $0.40
MATIC/USD – Daily Chart
The MATIC/USD daily chart showcases the crypto-economic price holding in ranges, rising less to breakout against the resistance at $0.70.
A chain of recessions has been playing out in the indicator trend lines, given that the Bollinger Bands are positioned at $0.581, $0.538, and $0.496 in that order. The stochastic oscillators are placed between 73.767 and 53.389. That implies the situation has been taken advantage of by bears in a lighter mode.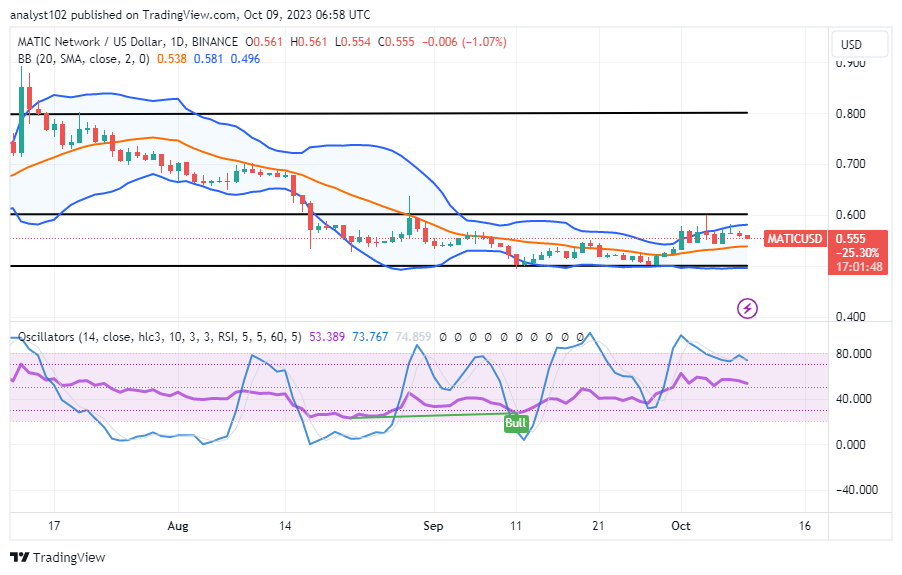
Can there be additional upswings in the near future to extend the upper Bollinger Band trend line past the $0.70 resistance level?
At the first stage of this technical analytics record, there is still a confirmation trade signal mode on the stochastic oscillators, as the MATIC/USD market holds in ranges depicted by $0.70 and $0.60 points, rising less than the lower value.
There appears to be a requirement for purchasers to wait for another round of conditions to presage that the blue line is reset around a lower range point of 20 or thereabouts before initiating instant executions in order to obtain further rises in the valuation of the crypto economy relative to the US currency. But investors might not wait for that to start investing in this cryptocurrency industry.
According to the analytics that support the likelihood that the MATIC/USD market will decline, traders planning to take a bearish stance should be strategic in their approach, especially since the price is likely to exhibit a series of smaller ups to touch the upper Bollinger Band before resuming a downward movement. If that is required, sellers must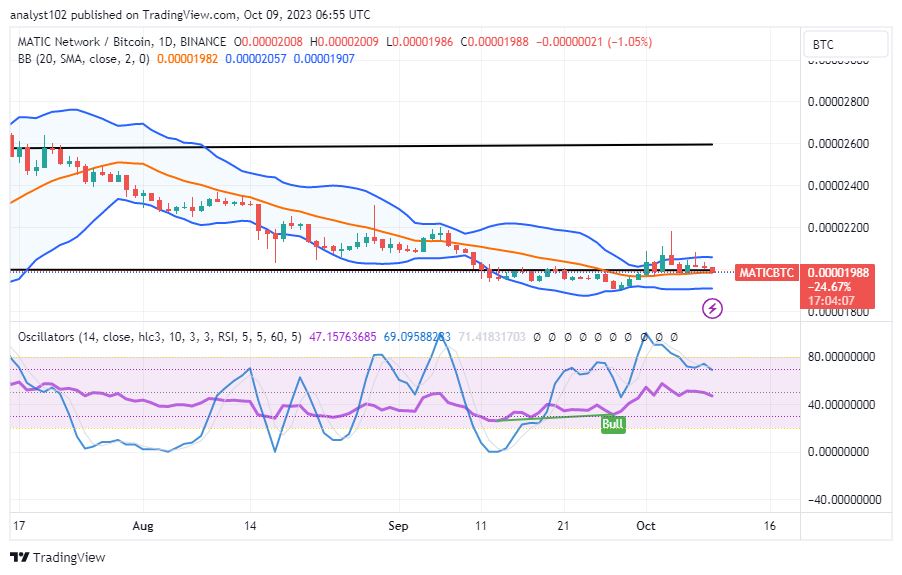
MATIC/BTC Price Analysis
In comparison, the Polygon market holds in ranges within the boundaries of the Bollinger Bands against the pushing velocity of Bitcoin, rising less to the topside of the indicators.
Whether significant or not, the factors influencing candlestick formation have been emerging with selling inputs that are likely to generate a series of Bollinger Band corrections. Between 69.09588283 and 47.15763685 are where the stochastic oscillators are situated. Additionally, kids are just beginning to show signs of despair. As a result, the base cryptocurrency runs the risk of sliding further downward before turning upward again.
Note: Cryptosignals.org is not a financial advisor. Do your research before investing your funds in any financial asset or presented product or event. We are not responsible for your investing results.
You can purchase Lucky Block here. Buy LBLOCK