Polygon (MATIC/USD) Market Point Has Risen, Leading to a Correction
Estimated Reading Time: 3 minutes
Don’t invest unless you’re prepared to lose all the money you invest. This is a high-risk investment and you are unlikely to be protected if something goes wrong. Take 2 minutes to learn more
Polygon Price Prediction – July 16
In the last few days, the Polygon market valuation rose higher to closely average the resistance of around $0.90, leading to a correction.
In order to maintain a negative percentage rate of 1.38, the retracement movement has resorted to setting up trade zones between $0.803 and $0.783. As it is, long-position takers have to be cautious sometimes before a retraction bargaining process can negate the current index capacity being carried by bears. We have opined that a formidable path to regaining up swings has been set in the ranges of $0.60 to $0.80 for buyers to look out for.
MATIC/USD Market
Key Levels:
Resistance levels: $0.85, $0.95, $1
Support levels: $0.65, $0.60, $0.55
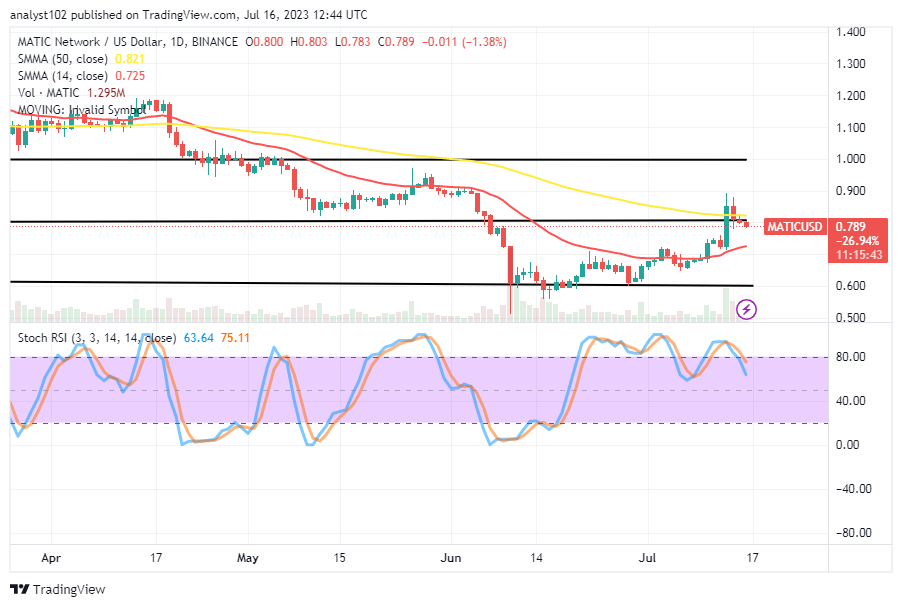
MATIC/USD – Daily Chart
The MATIC/USD daily showcases that the crypto-economic market point has risen, leading to a correction.
Presently, the formation of bullish candlesticks has given birth to a trial of breaking into upper range-bound zones of $0.80 and $1, as there has been room for necessary moves to the downside. The 14-day SMA indicator is at $0.725 underneath the $0.821 value line of the 50-day SMA indicator. In the meantime, the stochastic oscillators have progressively moved southward from the overbought area and are now situated between levels 75.11 and 63.64.
What is the current market velocity trend for MATIC/USD in this technical article?
It has been gently established that the forces of the MATIC/USD trade to the upside have developed to the extent of seeing the crypto’s valuation leading to a correction after touching a resistance of around $0.90 about four days ago.
In the light of getting to see further decreases, sellers would have to risk placing their orders alongside any possible active pushes to the south side with a mind to targeting lower points above the support of $0.60. They should protect their position with a stop-loss order placed around the resistance of $0.90.
At this moment, buying spree activities have to be suspended until the reading signs depicted by the Stochastic oscillators suggest the possibility of exhausting the pressures to the downside. It is recommended to include the presence of the 14-day SMA indicator when determining the time to launch a long order after the emergence of a bullish candlestick. 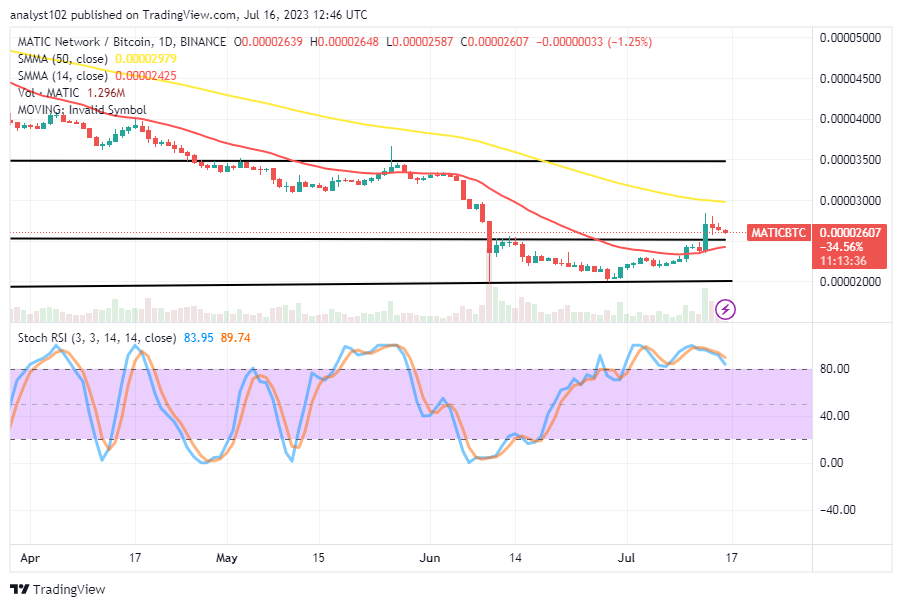
MATIC/BTC Price Analysis
In comparison, the Dogecoin market has risen in valuation against Bitcoin, leading to a correction along the path of a bullish candlestick that represented the increase in indices a few days ago.
In the interim, the base crypto may need to leave a chance for a line to move to the south side before breathing life back into upward-rising moments. The 14-day SMA indicator is still underneath the 50-day SMA indicator. The Stochastic Oscillators have successfully moved southward from levels of 89.74 to 83.95. Indecisiveness may result in the generation of weak forces in the days that follow.
Note: Cryptosignals.org is not a financial advisor. Do your research before investing your funds in any financial asset or presented product or event. We are not responsible for your investing results.
You can purchase Lucky Block here. Buy LBLOCK