Quant Price Prediction: QNT Turns Bearish as Price Drops to $86.54
Estimated Reading Time: 3 minutes
Don’t invest unless you’re prepared to lose all the money you invest. This is a high-risk investment and you are unlikely to be protected if something goes wrong. Take 2 minutes to learn more
Quant Price Prediction – October 9
The Quant price prediction shows that QNT keeps extending the bearish movement to the areas below the support level of $87.0.
QNT/USD Long-term Trend: Bearish (Daily Chart)
Key levels:
Resistance Levels: $95.0, $97.0, $99.0
Support Levels: $80.0, $78.0, $76.0
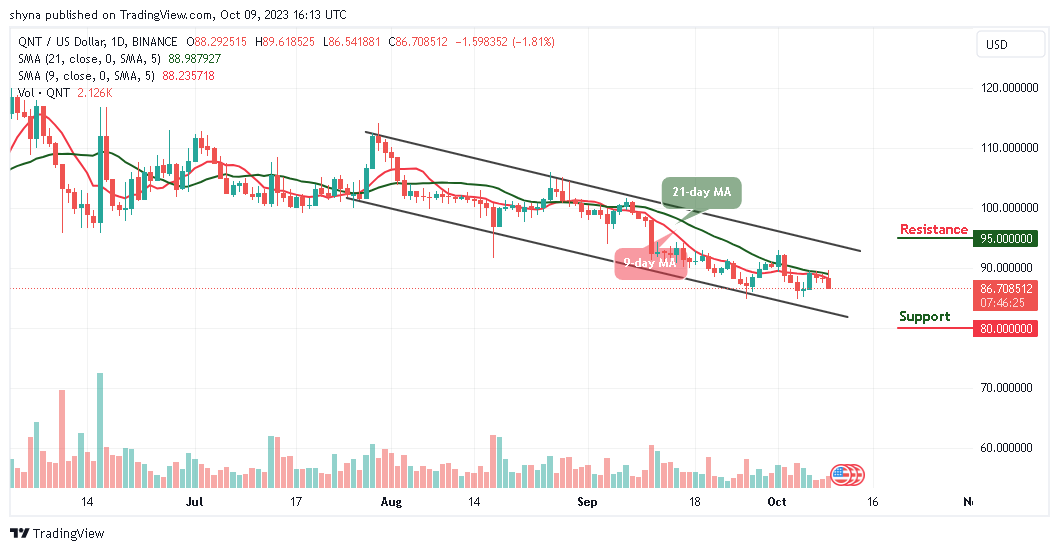
QNT/USD falls toward $86.50 once again as the coin heads to the lower boundary of the channel following a significant breakdown in the last few days. Therefore, the bearish control is seen across the market with other major digital assets posting similar losses as they slide below the 9-day and 21-day moving averages.
Quant Price Prediction: Quant (QNT) Could Slip Below $85.0
The Quant price is hovering at $86.70 with an intraday loss of 1.81%. Looking at the daily chart, the prevailing trend is bearish with expanding volatility as the coin is likely to consolidate in a bearish flag pattern. Meanwhile, a break below the support level of $85.0 is supposed to continue in the direction of the previous trend. In this case, QNT/USD is expected to drop and stay below to hit the critical support levels at $80.0, $78.0, and $76.0.
However, should the Quant price return above the 9-day and 21-day moving averages; the price could rise to $90.0 vital resistance. A further bullish drive could push the price to $95.0, $97.0, and $99.0 resistance levels. The technical indicator Volume is revealing a continuous bearish, which shows that the market may remain on the downside.
QNT/USD Medium-Term Trend: Ranging (4H Chart)
At the opening of the market today, the Quant price faces up to touch the resistance level of $89.6 but could drop below the channel if the bears continue with the market movement. Meanwhile, should the price drop further and move below the lower boundary of the channel, it could reach the support level at $83.0 and below.
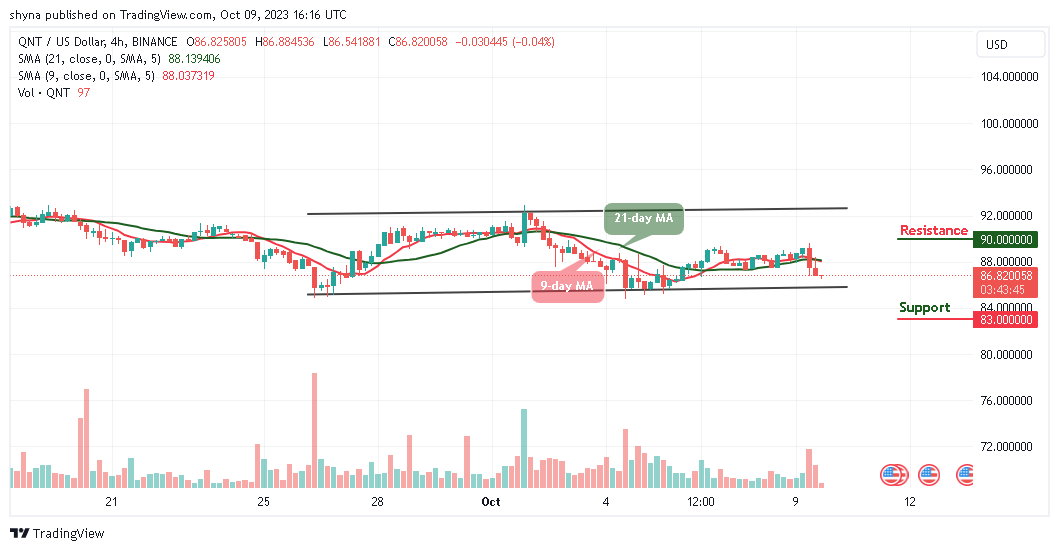
Nevertheless, if the bulls push the coin above the 9-day and 21-day moving averages, the Quant price could hit the resistance level of $90.0 and above. At the moment, the market may begin to move sideways or experience a slight uptrend if the 9-day MA remains above the 21-day MA.
Place winning Quant trades with us. Get QNT here