Lucky Block Price Prediction: LBLOCK/USD Gets Ready to Reclaim $0.00750 Level
Estimated Reading Time: 3 minutes
Don’t invest unless you’re prepared to lose all the money you invest. This is a high-risk investment and you are unlikely to be protected if something goes wrong. Take 2 minutes to learn more

Free Crypto Signals Channel
The Lucky Block price prediction shows that LBLOCK would begin to move higher as the coin heads to the upside.
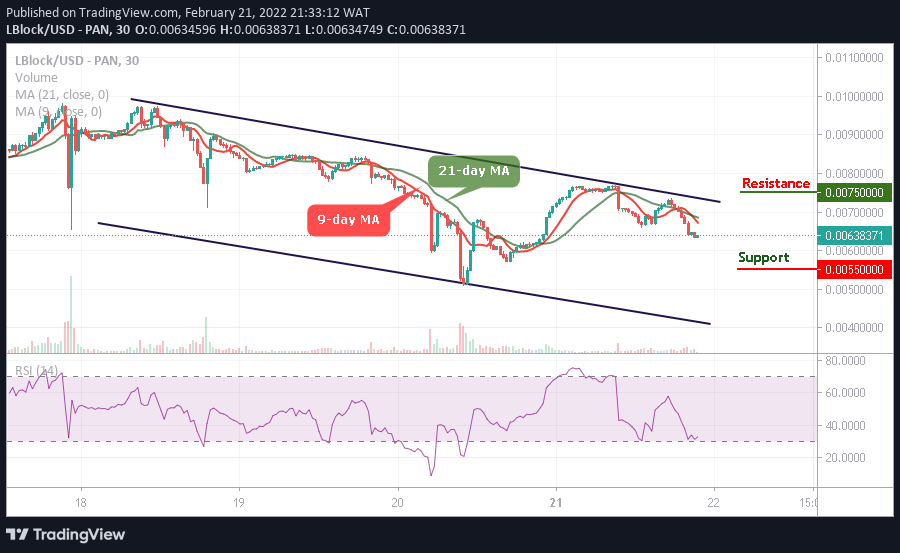
LBLOCK/USD Medium-term Trend: Bearish (30 Minutes Chart)
Key Levels:
Resistance levels: $0.00750, $0.00850, $0.00950
Support levels: $0.00550, $0.00450, $0.00350
LBLOCK/USD has performed tremendously since the last few days as the market price touched the monthly high of $0.00980. However, LBLOCK/USD is getting ready for another spike above the 9-day and 21-day moving averages as soon as the price faces the positive side.
Lucky Block Price Prediction: What to Expect from LBLOCK/USD
The Lucky Block price keeps trading around $0.00635 as the coin stays below the 9-day and 21-day moving averages. Looking at the 30-minute chart, it is obvious that the market would rise after the sideways movement, which is noticeable for the technical indicator Relative Strength Index (14) as the signal line prepares for a bullish movement.
Now, the bears are likely to gather momentum for the new buyers to come into the market. However, if the Lucky Block retreats a little bit, LBLOCK/USD would hit the supports at $0.0550, $0.00450, and $0.00350, but the investors should expect a bullish spike towards the upper boundary of the channel for it to hit the resistance levels of $0.00750, $0.00850, and $0.00950.
LBLOCK/USD Medium-term Trend: Ranging (15 Minutes Chart)
On the 15-minute chart, LBLOCK/USD is moving below the 9-day and 21-day moving averages at 0.00598 resistance level. The long-term moving average may likely lead to the downside but currently, as revealed on the chart, the market is starting a new trend as the price prepares to create a bullish candle.
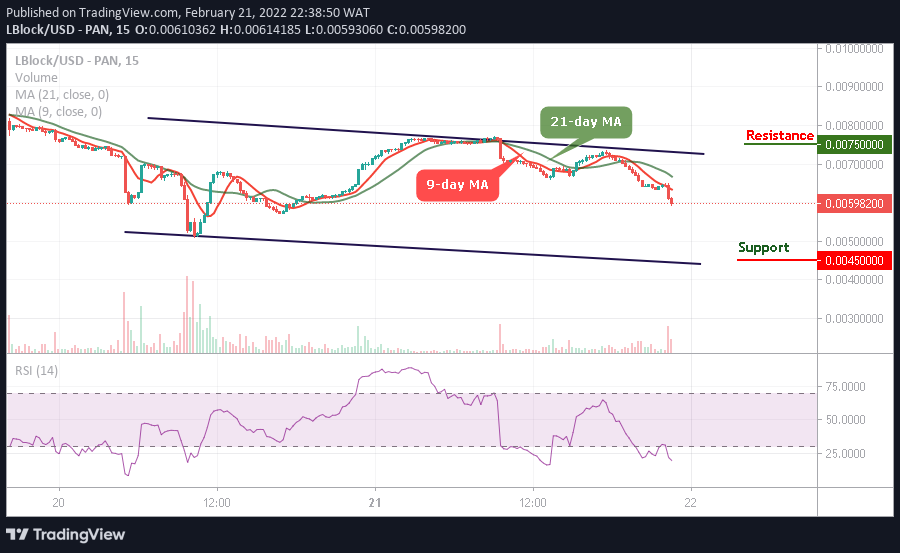
Meanwhile, if the buyers could push the price above the moving averages, higher resistance lies at $0.00750 and above. Moreover, should the bulls fail to move it to the upside, the nearest level of support towards the downside lies at $0.00450 and below as the Relative Strength Index moves within the oversold region, which could allow the existing buyers to buy the dip and gain more profits.
Read more: