Quant Price Prediction: QNT/USD Consolidates Above $120; Price Could Rebound
Estimated Reading Time: 2 minutes
Don’t invest unless you’re prepared to lose all the money you invest. This is a high-risk investment and you are unlikely to be protected if something goes wrong. Take 2 minutes to learn more
Quant Price Prediction – December 1
The Quant price prediction reveals that if bulls keep the market price above the moving averages, QNT will head to the upside.
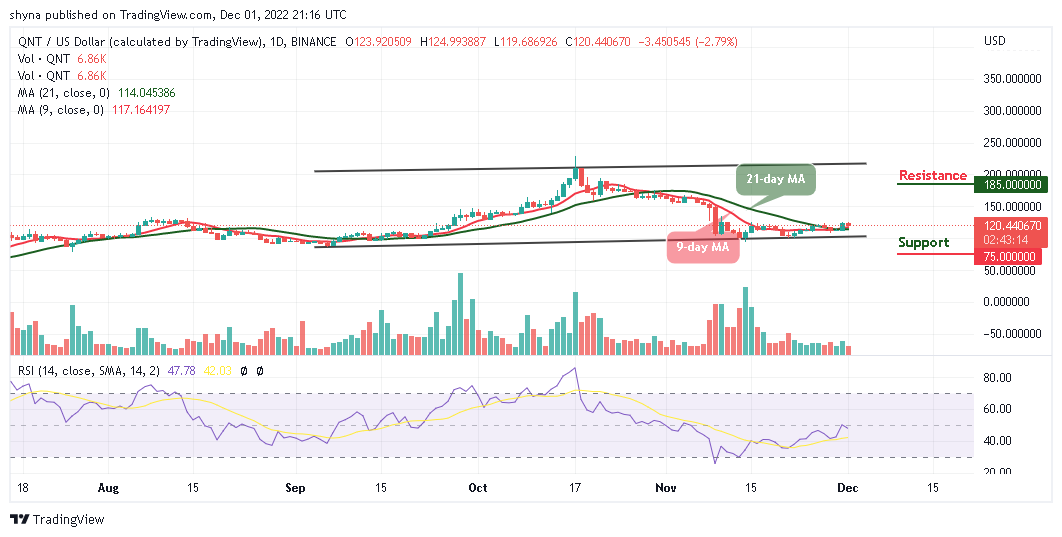
QNT/USD Medium-term Trend: Ranging (1D Chart)
Key Levels:
Resistance levels: $185, $205, $225
Support levels: $75, $55, $35
At the time of writing, QNT/USD is moving sideways, trading above the 9-day and 21-day moving averages. Meanwhile, as the Quant price hovers at $120.4, the bullish momentum will make the coin move toward the resistance level of $130 resistance level. Nevertheless, if the bulls fail to drive the price towards the upper boundary of the channel, the Quant price could slide below the moving averages.
Quant Price Prediction: QNT/USD Would Head to the Upside
The Quant price is changing hands at $120.4 where it could reclaim the resistance level of $124.9. The coin may stay above the 9-day and 21-day moving averages so that it can locate the potential resistance levels at $185, $205, and $225 towards the upper boundary of the channel. Meanwhile, the support levels remain at $75, $55, and $25 for the new buyers to come into the market while the technical indicator Relative Strength Index (14) remains below the 50-level.
QNT/USD Medium-term Trend: Ranging (4H Chart)
The Quant price crosses below the 9-day moving average but could head toward the 21-day moving average if the sellers increase the pressure. The technical indicator Relative Strength Index (14) remains below the 60-level, which suggests that the coin may retreat a little before gaining additional uptrends. This is to prepare the buyers for the upward movement and it could be the best time for more buyers to buy the dip.
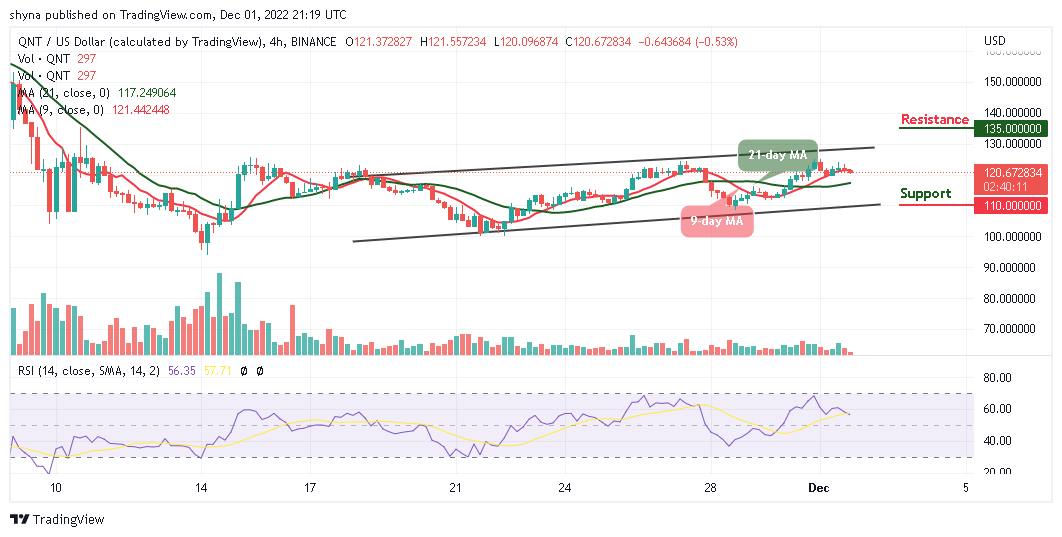
However, any bullish movement above the upper boundary of the channel could hit the resistance level at $135 and above. Nevertheless, QNT/USD could display, some bearish signals if the market price crosses below the 21-day moving average, and the Quant price may locate the critical support at $110 and below.
Place winning Quant trades with us. Get QNT here