Quant Price Prediction: QNT/USD Keeps Ranging as Price Prepares for the Upside
Estimated Reading Time: 3 minutes
Don’t invest unless you’re prepared to lose all the money you invest. This is a high-risk investment and you are unlikely to be protected if something goes wrong. Take 2 minutes to learn more
Quant Price Prediction – August 13
The Quant price prediction shows that QNT will recover to the upside as the coin moves to cross above the 9-day moving average.
QNT/USD Medium-term Trend: Ranging (1D Chart)
Key Levels:
Resistance levels: $115, $120, $125
Support levels: $90, $85, $80
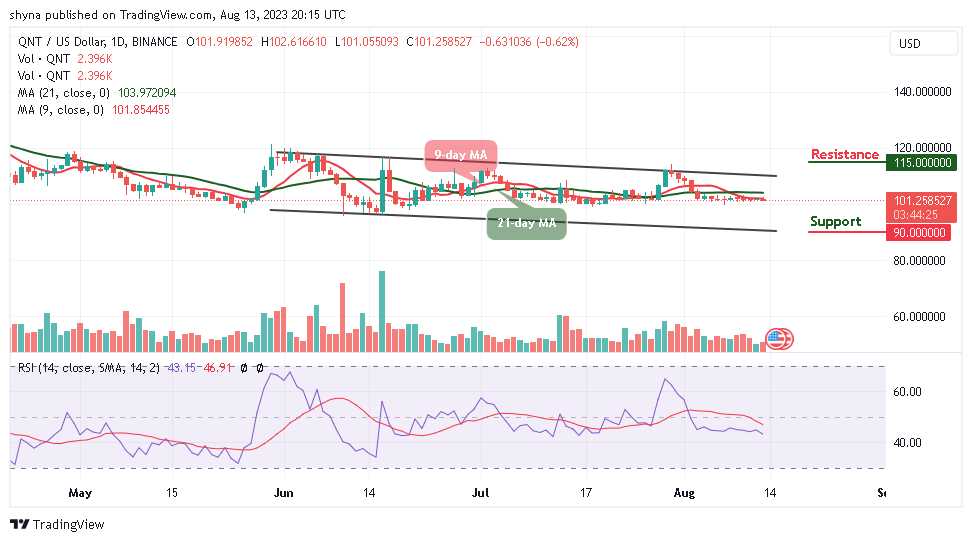
QNT/USD is moving sideways below the 9-day and 21-day moving averages at the moment. Meanwhile, the market could either go cheaper for new and existing buyers to buy or spike to cross above the moving averages to hit the nearest resistance level of $110. Meanwhile, should the bulls fail to push the price upward, it may continue to move sideways before any bullish movement comes to focus.
Quant Price Prediction: QNT/USD Could Move Higher
According to the daily chart, the Quant price could break to the upside if the bulls defend the $101 support level. However, any bullish cross above the upper boundary of the channel could push the price to the potential resistance levels of $115, $120, and $125.
Meanwhile, the upward movement may be delayed if the bears keep the market price below the 9-day and 21-day moving averages, sliding toward the lower boundary of the channel could touch the support levels at $90, $85, and $90. On that note, the technical indicator Relative Strength Index (14) stays below the 50-level to prepare the market for the bearish movement.
QNT/USD Medium-term Trend: Ranging (4H Chart)
Looking at the 4-hour chart, the Quant price is still consolidating within the channel and the coin is attempting to cross above the upper boundary of the channel. However, if the buyers push the price above this barrier, higher resistance could be located at $105 and above.
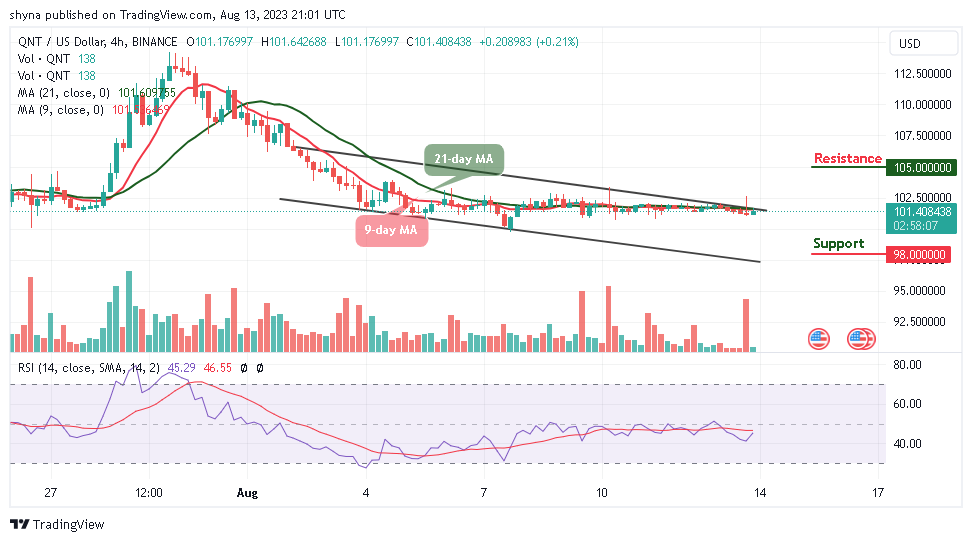
Moreover, the technical indicator Relative Strength Index (14) is likely to cross above the 50-level, indicating that bullish signals could play out. Therefore, if the bulls fail to push the current market value above the moving averages, the bears can return to the market, and the critical support level could be found at $98 and below.
Place winning Quant trades with us. Get QNT here