Quant Price Prediction: QNT/USD Regains Strength as Price Hits $115 Level
Estimated Reading Time: 3 minutes
Don’t invest unless you’re prepared to lose all the money you invest. This is a high-risk investment and you are unlikely to be protected if something goes wrong. Take 2 minutes to learn more
Quant Price Prediction – March 10
The Quant price prediction shows that QNT is going to move to the upside and it could cross above the moving averages.
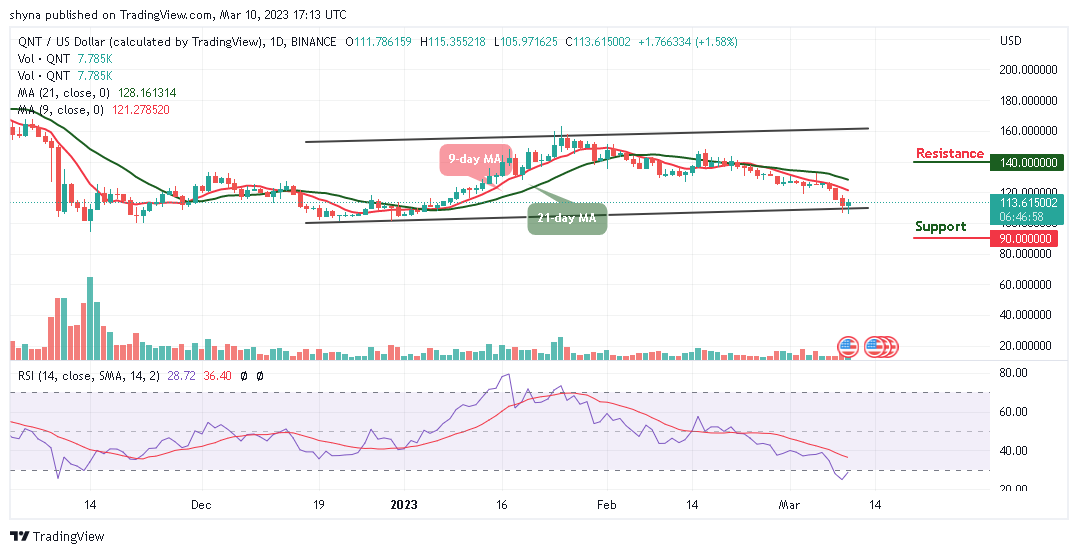
QNT/USD Long-term Trend: Ranging (1D Chart)
Key Levels:
Resistance levels: $140, $150, $160
Support levels: $90, $80, $70
QNT/USD will begin to move upward and it could hit the nearest resistance level of $120 in the next positive movement. However, the Quant price is currently trading at $113.6, the coin is likely to cross above the 9-day and 21-day moving averages to move higher.
Quant Price Prediction: QNT Price Will Begin the Upward Movement
The Quant price is seen hovering below the 9-day and 21-day moving averages, a positive break above the 9-day and 21-day moving averages will encourage more buyers to come into the market. They could push the coin to hit the resistance levels of 140, $150, and $160. On the contrary, if the price breaks to the south, the sell-off could gain traction with the next focus toward the lower boundary of the channel.
Moreover, if the support level of $100 is broken, the downside pressure may increase while the next critical supports could be located at $90, $80, and $70 while the buyers get ready to buy the dip. The technical indicator Relative Strength Index (14) is moving out of the oversold region which could bring new buyers into the market.
You can Read our more Crypto Guides:
- Big Eyes Coin Price Prediction 2023
- Will Shiba INU Reach 1 Cent 2023? SHIB Price Prediction
- Is Shiba inu (SHIB) Dead?
QNT/USD Medium-term Trend: Ranging (4H Chart)
According to the 4-hour chart, the Quant price is heading to the north as the coin crosses above the 9-day moving average aiming to cross above the 21-day moving average. However, if the Quant price continues with the bullish movement, it could cross above the upper boundary of the channel which will encourage the bulls to extend the rally toward the resistance level of $130 and above.

On the contrary, if the coin slides below the lower boundary of the channel, it could hit the nearest support at $110. Any further bearish movement could bring the coin to the support level of $100 and below. Meanwhile, there is a possibility that the Quant bulls will maintain the upward movement as the technical indicator Relative Strength Index (14) moves to cross above the 50-level, increasing the bullish signal for the coin.
Place winning Quant trades with us.