Ripple Holds above $0.50 Crucial Support, May Resume up Trending
Estimated Reading Time: 2 minutes
Don’t invest unless you’re prepared to lose all the money you invest. This is a high-risk investment and you are unlikely to be protected if something goes wrong. Take 2 minutes to learn more

Ripple (XRP) Long-Term Analysis: Bearish
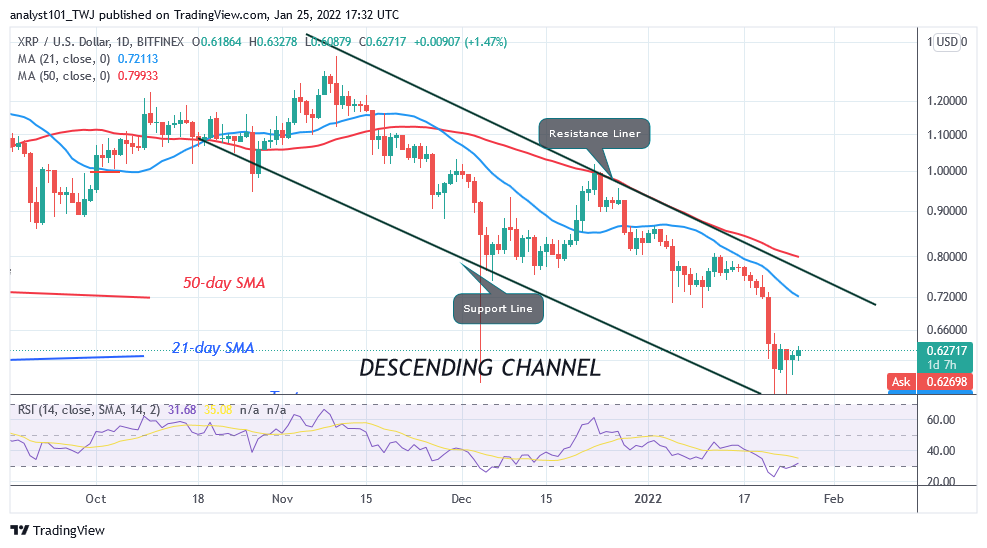
Ripple’s (XRP) price dropped to $0.54 low but may resume up trending. XRP is trading marginally as it fluctuates between $0.54 and $0.63 price levels. Since January 22, XRP’s upward move has been hindered at the high $0.63 on two occasions. Today, it is making another attempt to break above the resistance at $0.63. If buyers break the current resistance, XRP will rise to $0.80. Upside momentum will resume if price breaks above $1.00 overhead resistance.
Ripple (XRP) Indicator Analysis
Ripple has fallen to level 31 of the Relative Strength Index for period 14. XRP has already reached the oversold region as buyers emerge to push prices upward. Ripple, is above the 30% range of the daily stochastic. The cryptocurrency is in a bullish momentum. The price bars are below the moving averages indicating the downtrend.
Technical indicators:
Major Resistance Levels – $2.00, $2.50, $3.00
Major Support Levels – $1.50, $1.00, $0.50
What Is the Next Direction for Ripple (XRP)?
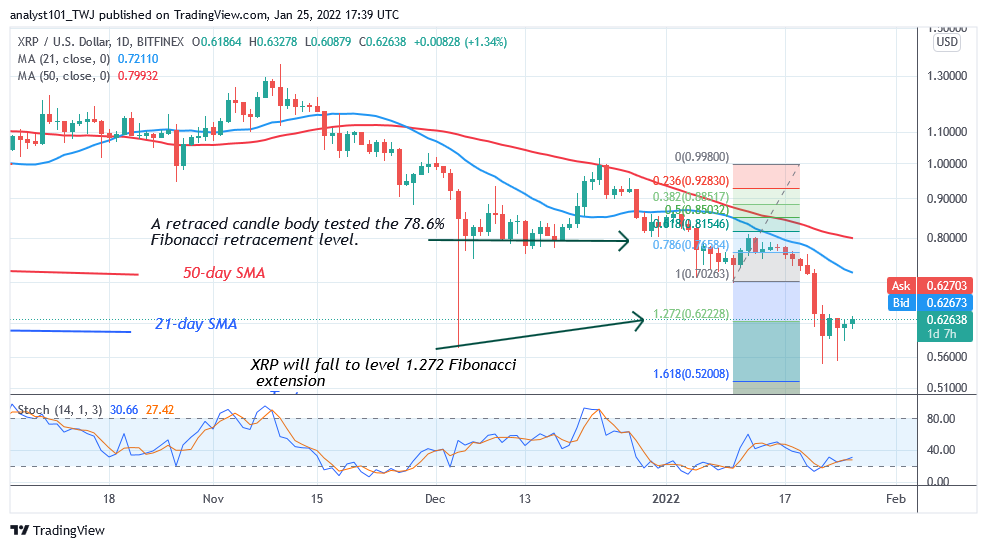
XRP/USD is in a downtrend but may resume up trending. The upward correction is facing resistance at the recent high. Nonetheless, on January 10 downtrend; a retraced candle body tested the 78.6% Fibonacci retracement level. The retracement suggests that XRP will fall but reverse at level 1.272 Fibonacci extension or $0.62. From the price action, the market is fluctuating above the Fibonacci extension.
You can purchase crypto coins here. Buy Tokens
Note: Cryptosignals.org is not a financial advisor. Do your research before investing your funds in any financial asset or presented product or event. We are not responsible for your investing results