Ripple Consolidates between $0.73 and $0.80, May Resume Uptrend
Estimated Reading Time: 2 minutes
Don’t invest unless you’re prepared to lose all the money you invest. This is a high-risk investment and you are unlikely to be protected if something goes wrong. Take 2 minutes to learn more
Ripple (XRP) Long-Term Analysis: Bearish
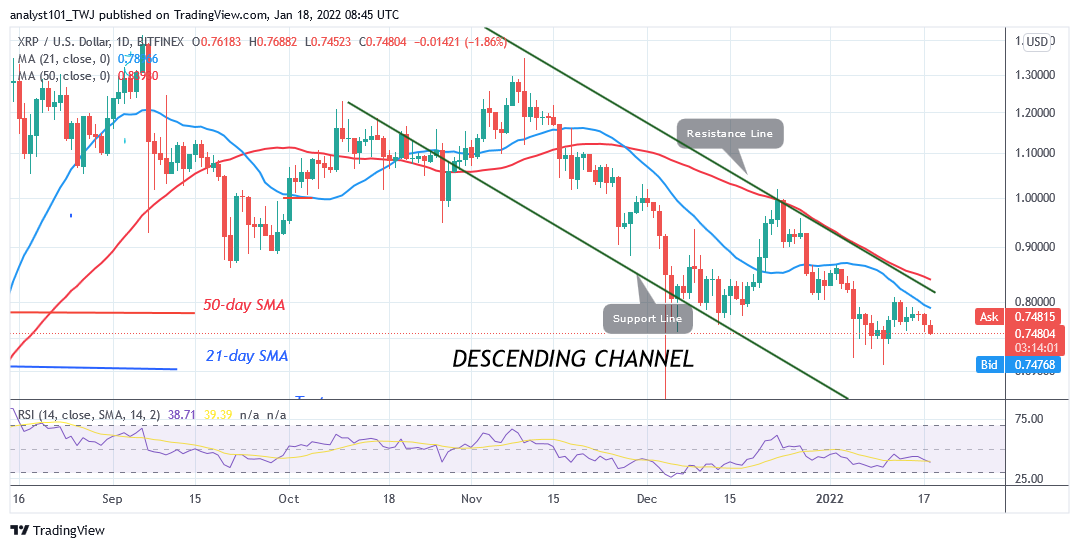
Ripple’s (XRP) price is in a downward correction but it may resume uptrend. The crypto’s price is declining as buyers failed to breach the $0.80 resistance. Since January 5, the XRP price has been fluctuating between $0.73 and $0.80 price levels. XRP price is declining to the lower price range. Sellers are intending to revisit the previous low at $0.73. On the downside, if sellers break below the $0.73 support, XRP will decline to $0.69 low. The bearish momentum could extend to the low of $0.57. This is the previous low of the December 4 price slump. Presently, XRP is pausing above the $0.74 price level. If sellers fail to break below the $0.73 support, XRP/USD will resume a range-bound move between $0.73 and $0.80.
Ripple (XRP) Indicator Analysis
Ripple has fallen to level 38 of the Relative Strength Index for period 14. XRP is still in the downtrend zone but below the centerline 50. Ripple, is below the 40% range of the daily stochastic. The cryptocurrency is in a bearish momentum.
Technical indicators:
Major Resistance Levels – $2.00, $2.50, $3.00
Major Support Levels – $1.50, $1.00, $0.50
What Is the Next Direction for Ripple (XRP)?
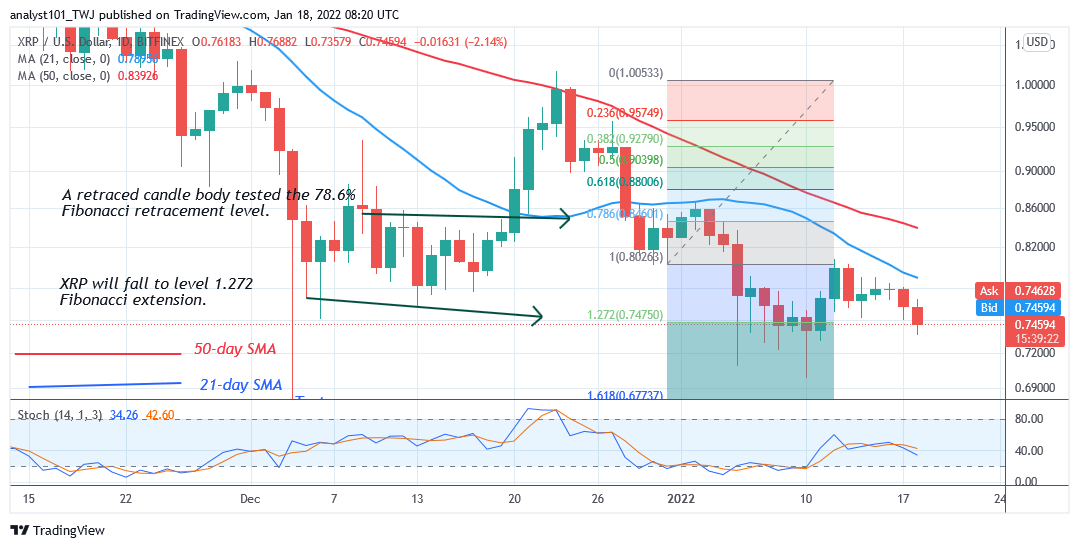
On the 4-hour chart, XRP/USD has been in a downtrend but it may resume uptrend. The altcoin has been in a downward move since the rejection at the $1.00 overhead resistance. XRP price is fluctuating between $0.73 and $0.80 price levels. Meanwhile, on December 31 downtrend; a retraced candle body tested the 78.6% Fibonacci retracement level. The retracement suggests that XRP price will fall to level 1.272 Fibonacci extension or $0.7475. From the price action, the market is retesting the Fibonacci extension.
You can purchase crypto coins here. Buy Tokens
Note: Cryptosignals.org is not a financial advisor. Do your research before investing your funds in any financial asset or presented product or event. We are not responsible for your investing results