Quant Price Prediction: QNT/USD Regains Strength; Price Trades Near $110 Level
Estimated Reading Time: 3 minutes
Don’t invest unless you’re prepared to lose all the money you invest. This is a high-risk investment and you are unlikely to be protected if something goes wrong. Take 2 minutes to learn more
Quant Price Prediction – December 31
The Quant price prediction shows that QNT is going to move to the upside as the coin touches the daily high at the $107.9 level.
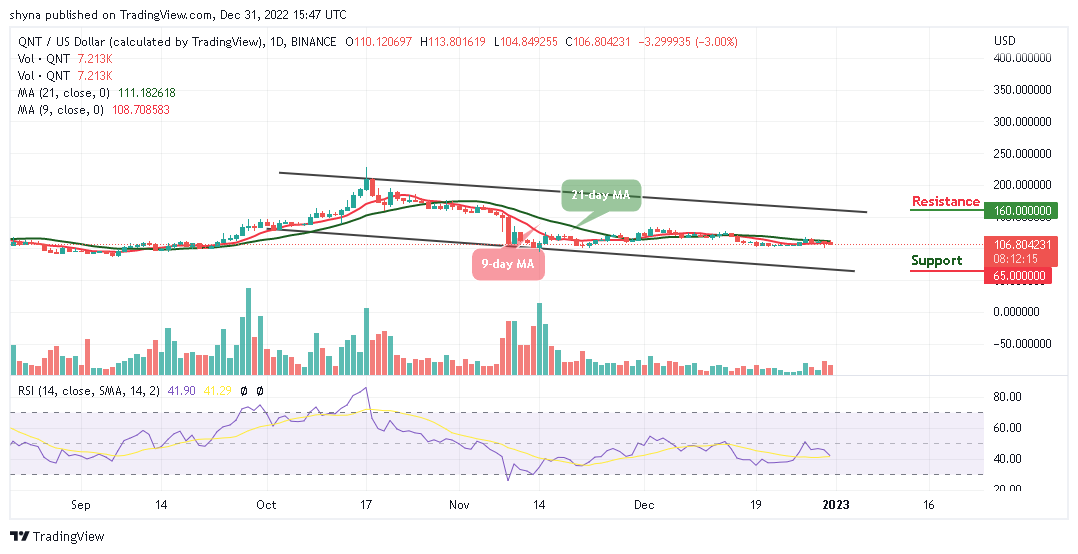
QNT/USD Long-term Trend: Ranging (1D Chart)
Key Levels:
Resistance levels: $120, $140, $160
Support levels: $100, $80, $60
QNT/USD will hit the $110 resistance level in the next positive movement as the difficult time seems to be fading out for the coin. However, the Quant price is currently trading at $106.88, the coin crosses above the 9-day moving average, and it could probably cross above the 21-day moving average for it to move higher.
Quant Price Prediction: QNT Price Will Spike to the Upside
The Quant price is seen hovering within the 9-day and 21-day moving averages. A break toward the upper boundary of the channel could encourage more buyers to increase their entries, and they could push the coin to hit the resistance levels of 120, $140, and $160. On the contrary, if the price breaks to the south, the sell-off could gain traction with the next focus toward the lower boundary of the channel.
Moreover, if the support level of $105 is broken, the downside pressure may increase while the next supports may be created around $100, $80, and $60 respectively as the buyers could get ready to buy the dip. However, the technical indicator Relative Strength Index (14) can cross above the 60-level to prepare new buyers to invest in the coin.
QNT/USD Medium-term Trend: Ranging (4H Chart)
On the 4-hour chart, the Quant price is hovering below the 9-day and 21-day moving averages to confirm the sideways movement. If the coin faces the upside and heads toward the upper boundary of the channel, this will encourage the bulls to extend the rally toward the resistance level of $120 and above.
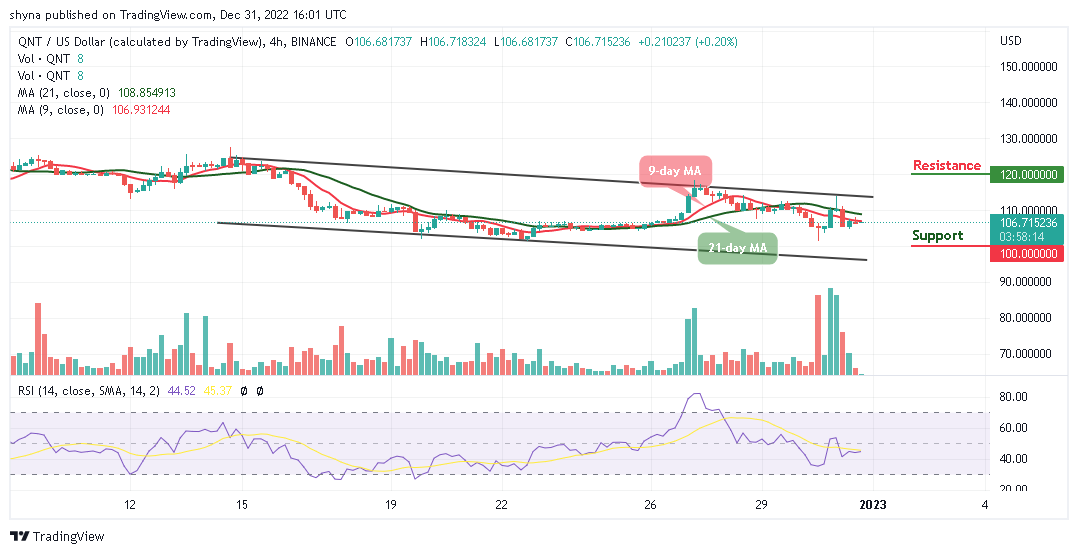
Nevertheless, any further bearish movement toward the lower boundary of the channel could take the coin to the support level of $100 and below. Meanwhile, there is a possibility that the Quant will retreat before heading to the upside as the technical indicator Relative Strength Index (14) remains below the 50-level, preparing the market for the bullish movement.
Place winning Quant trades with us. Get QNT here