Quant Price Prediction: QNT/USD Turns Lower as Price Could Press Higher
Estimated Reading Time: 3 minutes
Don’t invest unless you’re prepared to lose all the money you invest. This is a high-risk investment and you are unlikely to be protected if something goes wrong. Take 2 minutes to learn more
Quant Price Prediction – December 28
The Quant price prediction reveals that QNT would begin to form higher as the coin prepares for the bullish movement.
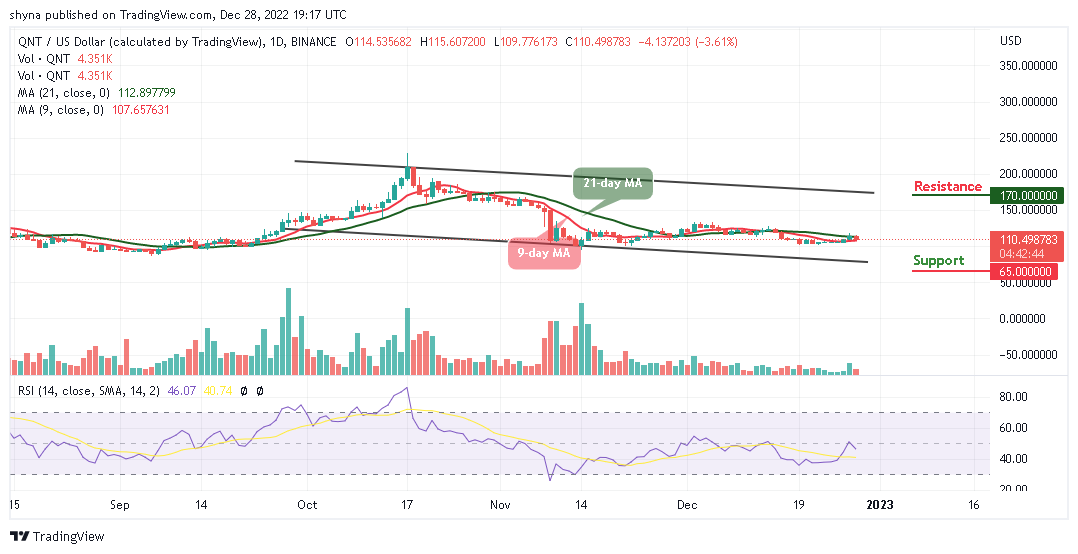
QNT/USD Medium-term Trend: Ranging (1D Chart)
Key Levels:
Resistance levels: $170, $190, $210
Support levels: $65, $45, $25
QNT/USD is sliding within the 9-day and 21-day moving averages as the coin prepares to face the upper boundary of the channel. The market price is hovering at $110.49, but the Quant price may retreat a little bit to allow new investors to come into focus.
Quant Price Prediction: QNT/USD May Retreat to Break Higher
The Quant price could retreat before breaking above the 21-day moving average as the coin hovers around $110.49. However, the Quant price is likely to cross below the 9-day moving average and but any bullish cross above the 21-day moving average could push the coin to the potential resistance levels of $170, $190, and $210.
On the contrary, this technical analysis might not play out if the sellers increase the selling pressure, crossing below the lower boundary of the channel will hit the support levels of $65, $45, and $25. Moreover, the technical indicator Relative Strength Index (14) is sliding below the 50-level, suggesting a bearish signal in the market.
QNT/USD Medium-term Trend: Ranging (4H Chart)
Looking at the 4-hour chart, the Quant price would move up higher if the coin crosses above the 9-day moving average. However, the long-term moving averages will begin the bullish movement as the market prepares for a new trend.
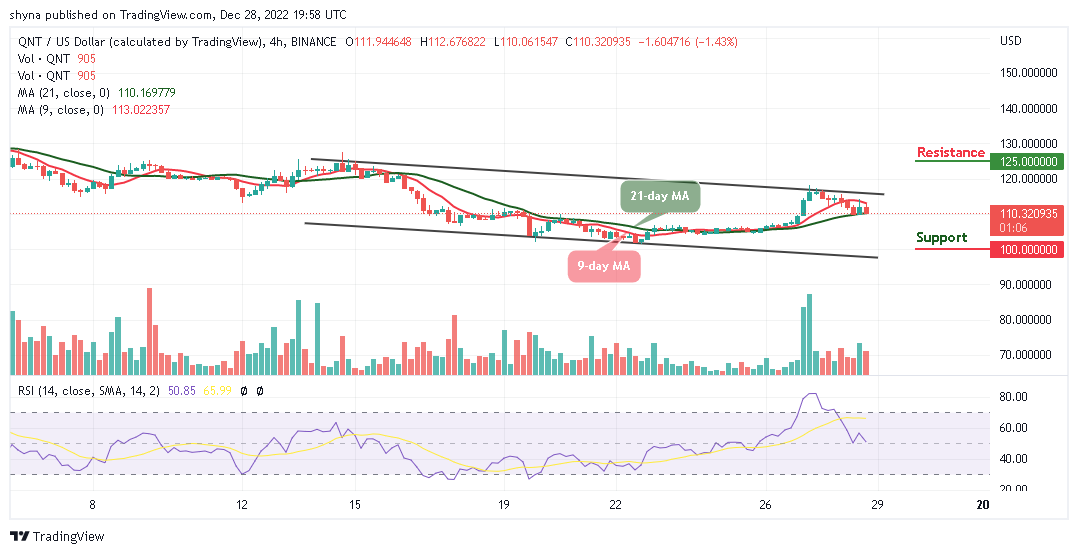
However, if the buyers push the price above the upper boundary of the channel, higher resistance could be reached at $125 and above as the technical indicator Relative Strength Index (14) moves to cross below the 50-level. Moreover, should the bulls fail to move the current market value above, the bears may step into the market, and the nearest support level could be located at $100 and below.
Place winning Quant trades with us. Get QNT here