Ripple Declines and Trades in a Tight Range as It Struggles Below $0.59
Estimated Reading Time: 2 minutes
Don’t invest unless you’re prepared to lose all the money you invest. This is a high-risk investment and you are unlikely to be protected if something goes wrong. Take 2 minutes to learn more

Free Crypto Signals Channel
Ripple (XRP) Long-Term Analysis: Bearish
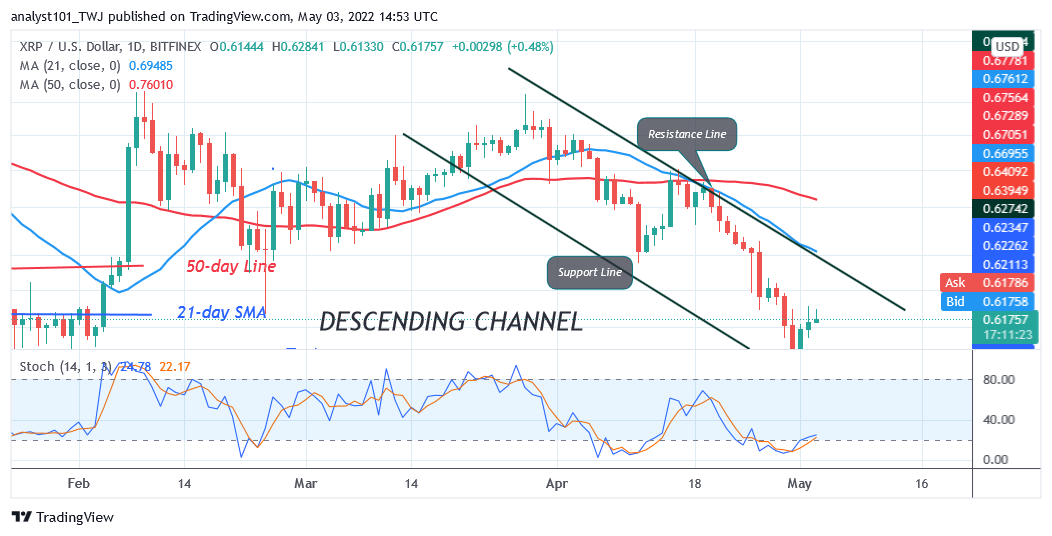
Ripple’s (XRP) price is in a downtrend as it struggles below $0.59. Since April 30, the altcoin has been making an upward correction but struggles below the resistance at $0.59 high. On the downside, if the current support at $0.56 holds and the bulls fail to break the resistance at $0.59, XRP will be trading in a tight range. On the upside, if the bulls break the resistance at $0.59, XRP/USD will rise and revisit the previous highs of $0.68 and $0.75 price levels. On the downside, a further downward move is unlikely as the altcoin reaches the oversold region. The cryptocurrency will be compelled to a range-bound move between $0.56 and $0.75 price levels if the current support holds.
Ripple (XRP) Indicator Analysis
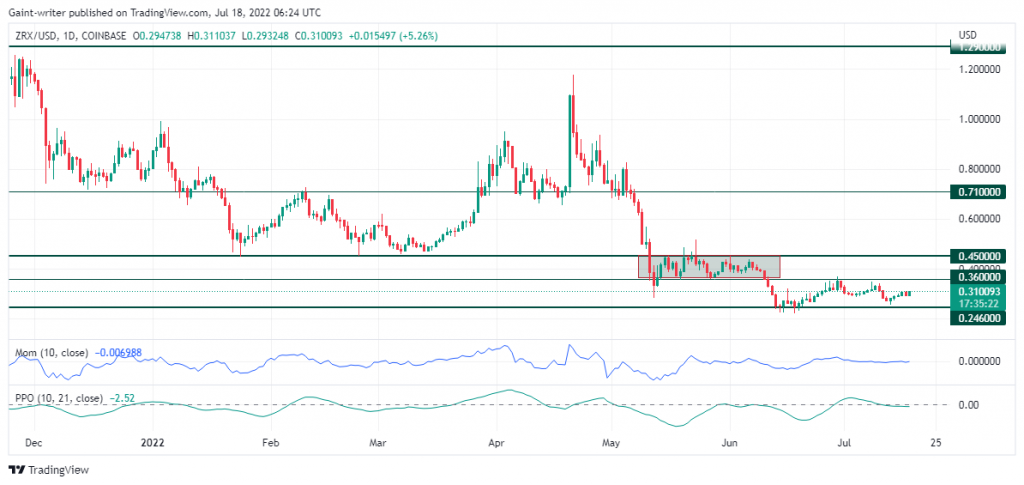
Ripple is at level 32 of the Relative Strength Index for period 14. The altcoin was earlier in the oversold region at level 25 as buyers emerge to push the crypto upward. Similarly, XRP is below the 20% range of the daily stochastic. It indicates that the market has reached the oversold region. The cryptocurrency has reached bearish exhaustion. The 21-day line SMA and the 50-day line SMA are sloping southward indicating the downtrend.
Technical indicators:
Major Resistance Levels – $2.00, $2.50, $3.00
Major Support Levels – $1.50, $1.00, $0.50
What Is the Next Direction for Ripple (XRP)?
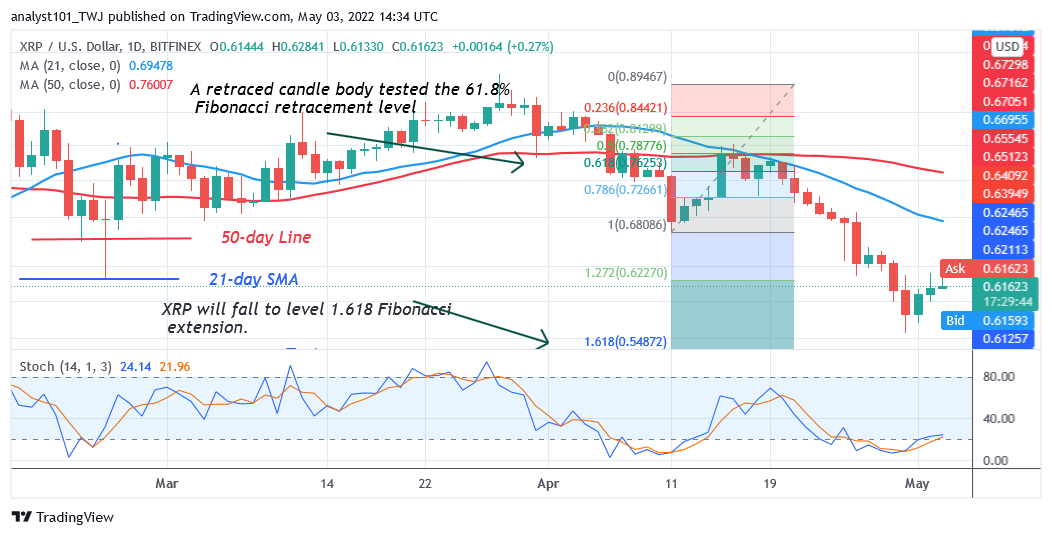
XRP/USD is in a downtrend but trades in a tight range as it struggles below $0.59. Ripple is likely to encounter a price breakdown or a rebound. Meanwhile, on April 11 downtrend; a retraced candle body tested the 61.8% Fibonacci retracement level. The retracement indicates that XRP will fall to level 1.618 Fibonacci extension or $0.548.
You can purchase crypto coins here. Buy LBlock
Note: Cryptosignals.org is not a financial advisor. Do your research before investing your funds in any financial asset or presented product or event. We are not responsible for your investing results