Ripple Faces Rejection at $0.90 as It Resumes Consolidation above $0.79
Estimated Reading Time: 2 minutes
Don’t invest unless you’re prepared to lose all the money you invest. This is a high-risk investment and you are unlikely to be protected if something goes wrong. Take 2 minutes to learn more

Free Crypto Signals Channel
Ripple (XRP) Long-Term Analysis: Bearish
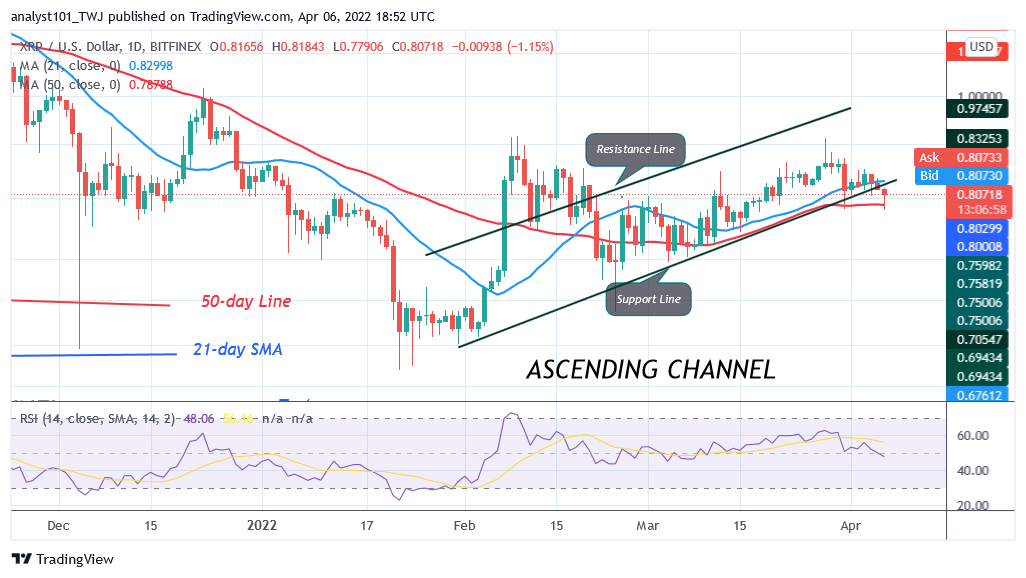
Ripple’s (XRP) price has fallen below the moving averages as it resumes consolidation above $0.79. XRP is above the 50-day SMA but below the 21-day SMA as it resumes a range-bound move. On the downside, if the bears break below the 50-day SMA, XRP will fall and resume downward correction. XRP/USD will decline to the low of $0.69. On the upside, if buyers push XRP above the 21-day SMA, the bulls will attempt to push the altcoin to the high of $0.90 resistance. The XRP’s price will be fluctuating between the moving averages if the 50-day SMA holds. Also, XRP will trend when the moving average lines are breached.
Ripple (XRP) Indicator Analysis
Ripple has fallen to level 46 of the Relative Strength Index for period 14. XRP has fallen to the downtrend zone and is capable of a further downward move. XRP/USD is below the 40% range of the daily stochastic. It indicates that XRP is in a bearish momentum. The 21-day line and the 50-day line moving averages are sloping upward indicating an uptrend.
Technical indicators:
Major Resistance Levels – $2.00, $2.50, $3.00
Major Support Levels – $1.50, $1.00, $0.50
What Is the Next Direction for Ripple (XRP)?
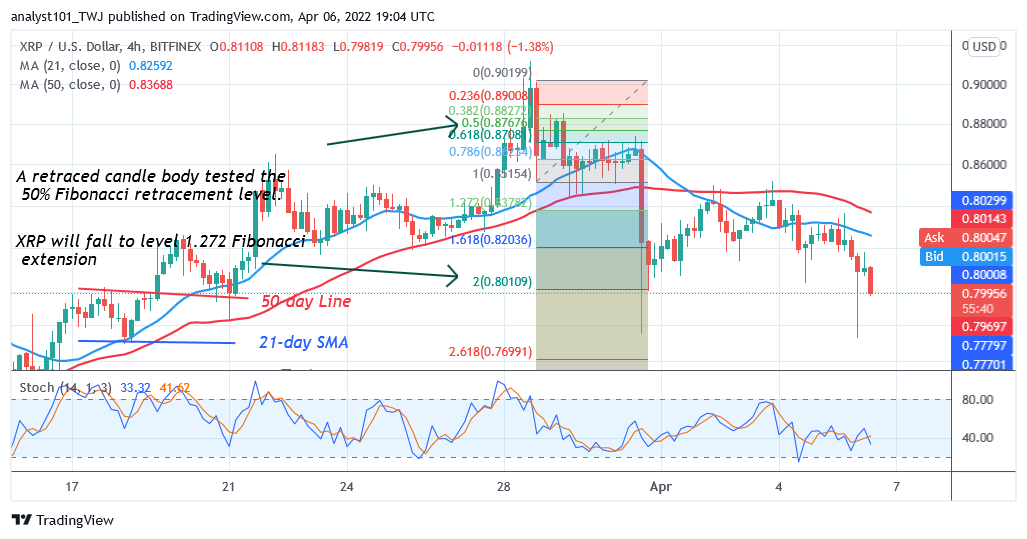
On the 4 –hour chart, XRP/USD has been in a downward move as it resumes consolidation above $0.79. Meanwhile, on March 28 downtrend; a retraced candle body tested the 50% Fibonacci retracement level. The retracement indicates that XRP will fall to level 2.0 Fibonacci extension or $0.80. From the price action, XRP has fallen and it is retesting the 2.0 Fibonacci extension.
You can purchase crypto coins here. Buy LBlock
Note: Cryptosignals.org is not a financial advisor. Do your research before investing your funds in any financial asset or presented product or event. We are not responsible for your investing result