Ripple Drops Sharply as It Reaches the Previous Low at $0.36
Estimated Reading Time: 2 minutes
Don’t invest unless you’re prepared to lose all the money you invest. This is a high-risk investment and you are unlikely to be protected if something goes wrong. Take 2 minutes to learn more
Ripple (XRP) Long-Term Analysis: Bearish
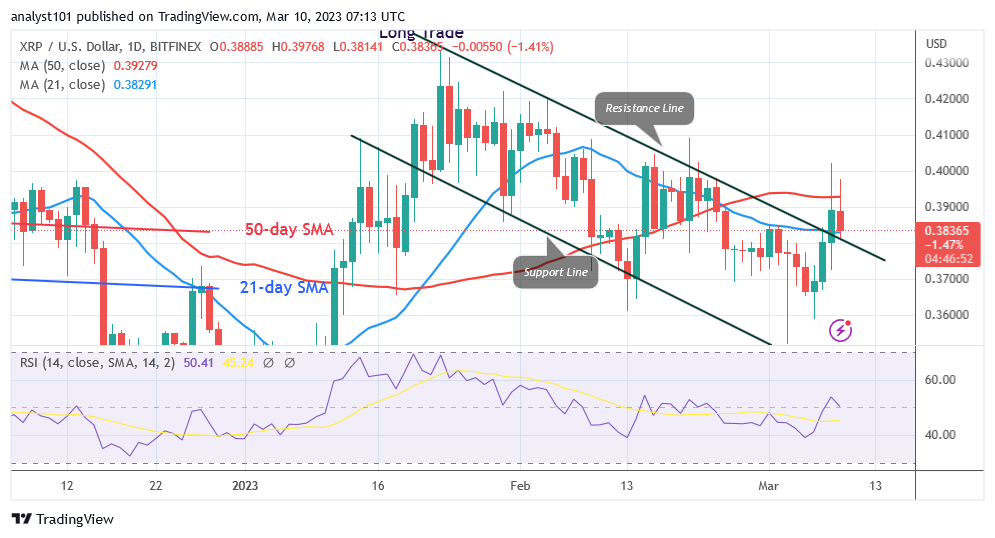
The price of Ripple (XRP) is falling as it reaches the previous low at $0.36. On March 8, the cryptocurrency’s price rose above the moving average lines, but it is now facing rejection at the recent high. Today, XRP has fallen below the moving average lines and is facing resistance at the $0.40 level. On the downside, if XRP is trapped between the moving average lines, it will be forced to make a range-bound move. The cryptocurrency asset will drop back to its previous lows of $0.36 and $0.34 if the price drops below the moving average lines. Today, XRP has fallen and is trading just below the $0.37 support level.
Ripple (XRP) Indicator Analysis
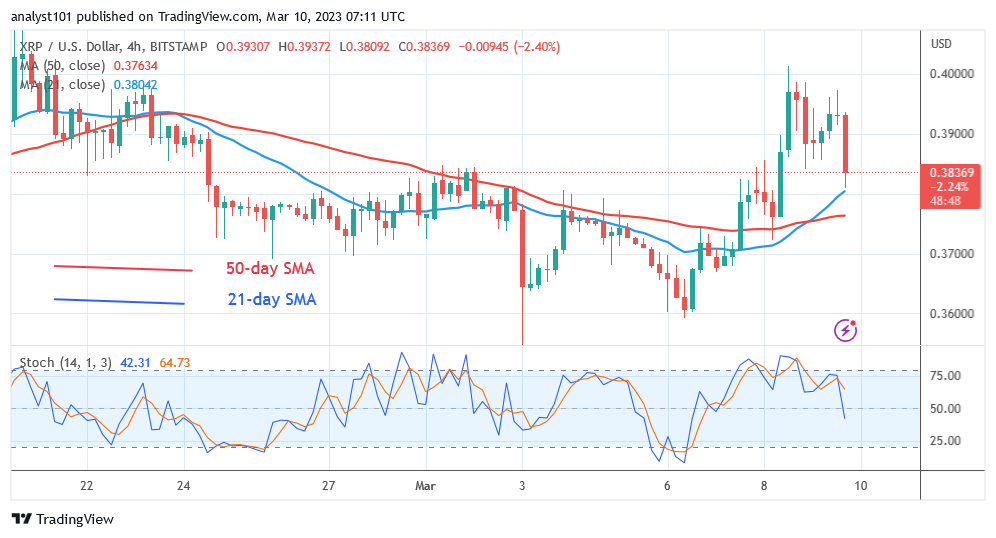
Ripple is at Relative Strength Index level 44 for period 14. XRP is in a bearish trend and could continue to fall. As the price bars fall below the moving average lines, the coin may fall. XRP is in a bearish momentum below the daily Stochastic level of 25. The coin is getting close to being oversold.
Technical indicators:
Major Resistance Levels – $2.00, $2.50, $3.00
Major Support Levels – $1.50, $1.00, $0.50
What Is the Next Direction for Ripple (XRP)?
Ripple is currently in a bearish trend zone as it reaches the previous low at $0.36. The current decline could extend to the previous lows of $0.36 and $0.34. Today’s price drop reached a low of $0.36 before reversing. It is falling once more, approaching the previous low.
You can purchase crypto coins here. Buy LBLOCK
Note: Cryptosignals.org is not a financial advisor. Do your research before investing your funds in any financial asset or presented product or event. We are not responsible for your investing result.