Eigenlayer (EIGEN/USDT) Eyes Break Above $1.000 Level with Increased Bulls Participation
Estimated Reading Time: 3 minutes
Don’t invest unless you’re prepared to lose all the money you invest. This is a high-risk investment and you are unlikely to be protected if something goes wrong. Take 2 minutes to learn more

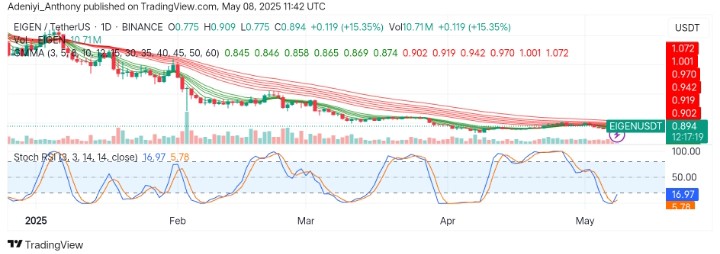
After weeks of heavy sell-offs and occasional consolidation, EigenLayer, against the Tether, is stepping into the spotlight. The pair has been in a steep downtrend since the beginning of the year, marked by a series of lower highs and lows.
However, recent price action has revealed an attempt at a bullish breakout from a compression zone. This move is followed by a notable volume surge as other indicators on the chart suggest an imminent upside movement.
To this end, the Guppy Multiple Moving Averages (GMMAs) remain the same, unlike the Stochastic RSI. Therefore, caution is needed in this situation.
Currently, Eigenlayer trades at $0.894 with over 15% daily gain and 10.71 million traded volumes.
Technical Indicators
Major Resistance Levels: $0.920, $1.070, and $1.500
Major Support Levels: $0.770, $0.600, and $0.500
EigenLayer Technical Analysis
The analysis for Eigenlayer against the Tether on the daily chart shows that the pair is on a bullish breakout after prolonged range-bound activities. However, the short-term EMAs are yet to cross above the long-period EMAs, but compression has taken place, hinting at the possibility of more bullish activities ahead.
On the other hand, the Stochastic RSI suggests the bulls are pressing hard as the lines curl upside from the oversold region. To this end, the spike in volume suggests renewed interest, but caution is warranted until the $0.920 level is breached.
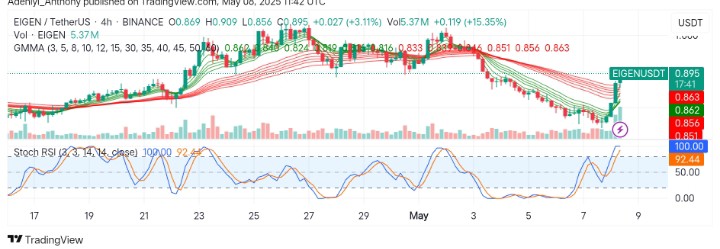
EIGEN/USDT Analysis: What’s Next?
On the 4H chart, EIGEN/USDT appears to be receiving more attention from the bullish traders as the price moves to the north with every session. However, the GMMAs still signal the presence of the bears in the market despite price action above the long-period EMAs.
From another angle, the Stochastic oscillator suggests a cool-off is ongoing with the blue stretching forward after hitting the 100-mark level. This shows the pair is overbought, and a pullback is possible before further upside movement if momentum is sustained.
To this end, if more bullish volume is recorded in the next session, a move above $1.000 may be seen.
You can purchase crypto coins here. Buy LBlock