Solana (SOL/USD) Market Heavily Opposes Mooning Acts
Estimated Reading Time: 3 minutes
Don’t invest unless you’re prepared to lose all the money you invest. This is a high-risk investment and you are unlikely to be protected if something goes wrong. Take 2 minutes to learn more
Solana Price Prediction – November 11
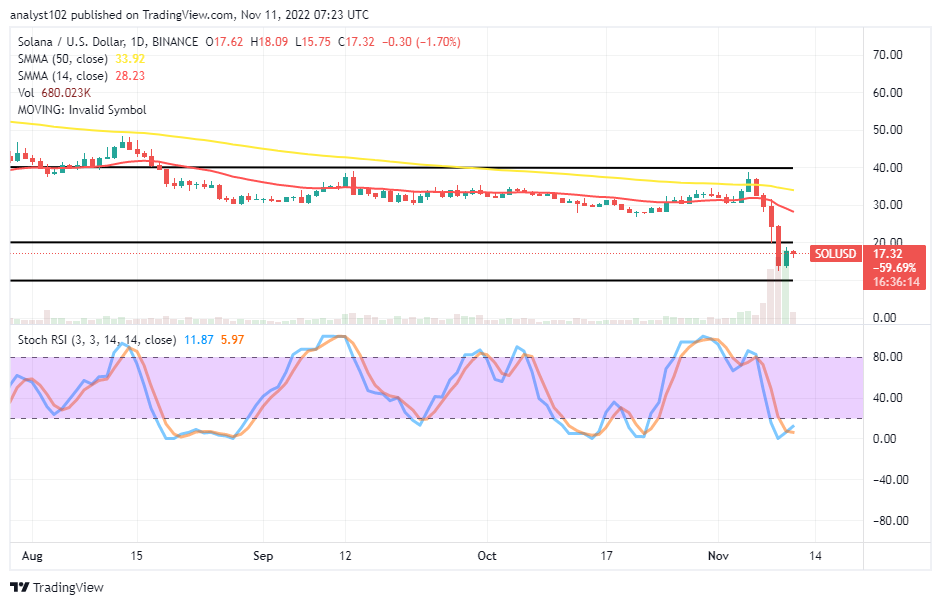
A consistency falling in a downward-straight line in the SOL/USD trade operations shows that the crypto market heavily opposes the mooning acts of buyers. The downsizing motions have prevailed between the high and the low-value lines, $18.09 and $15.75, keeping at -1.70 percentage rates.
SOL/USD Market
Key Levels:
Resistance levels: $25, $30, $35
Support levels: $10, $7.50, $5
SOL/USD – Daily Chart
The SOL/USD daily chart reveals the crypto market heavily opposes mooning acts of long-position placers. Selling left-over pressures have been capped between $20 and $10 values. The 14-day SMA indicator is at $28.23 point, underneath the $33.92 value line of the 50-day SMA indicator. The Stochastic Oscillators have dipped into the oversold region, trying to cross northbound at 5.97 and 11.87 levels.
Will the SOL/USD market re-establish its positions between the $20 and $10 price lines?
The SOL/USD trade has a higher tendency of re-building back its support from around the $10 level as the crypto market opposes the mooning acts of bulls in recent operations. A line of testing moments may play out around the $20 level for some time before gaining a smooth-running upward plunge into a bullish trend. Buyers need not panic about any sell-offs against the $10 support line. Investors may add more to their positions at this point.
On the downside of the technical analysis, there is a point of resistance line around $20 that sellers must capitalize on right now. The moment a fearful breakout occurs against the value line might be a resumption of an upward trend. If that sentiment materializes, short-position placers will have to postpone their activities until another round of formation pattern emerges.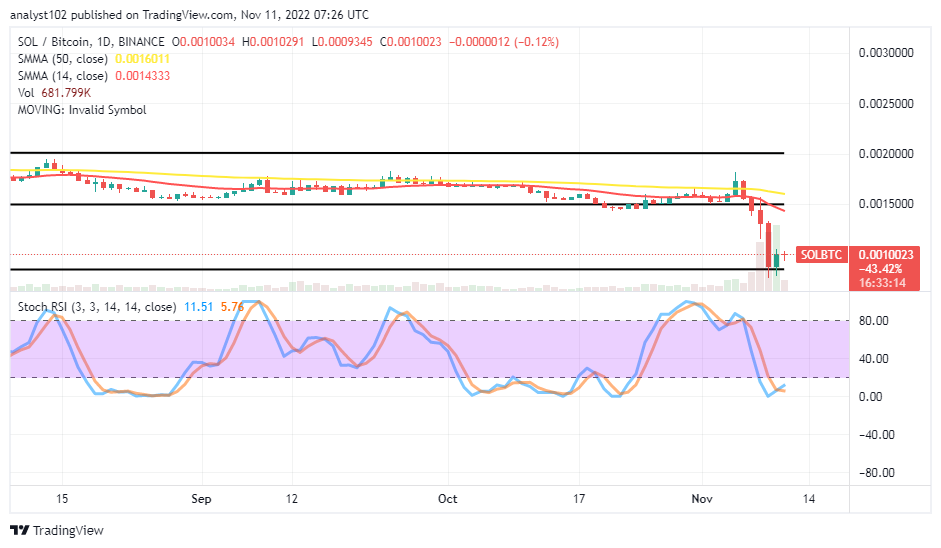
SOL/BTC Price Analysis
In comparison, Solana has dropped in value against the trending ability of Bitcoin. The cryptocurrency pair market heavily opposes mooning acts of long-position placers. The declining movements have led to the creation of lower-range points. The 1-day SMA indicator is underneath the 50-day SMA indicator. The Stochastic Oscillators have dipped into the oversold region, trying to cross northbound at 5.76 and 11.51 levels. The base crypto appears to swing back from the lower trading line.
Note: Cryptosignals.org is not a financial advisor. Do your research before investing your funds in any financial asset or presented product or event. We are not responsible for your investing results.
You can purchase Lucky Block here. Buy LBLOCK