Solana (SOL/USD) Market Runs Into a Consolidation Move
Estimated Reading Time: 3 minutes
Don’t invest unless you’re prepared to lose all the money you invest. This is a high-risk investment and you are unlikely to be protected if something goes wrong. Take 2 minutes to learn more
Solana Price Prediction – November 17
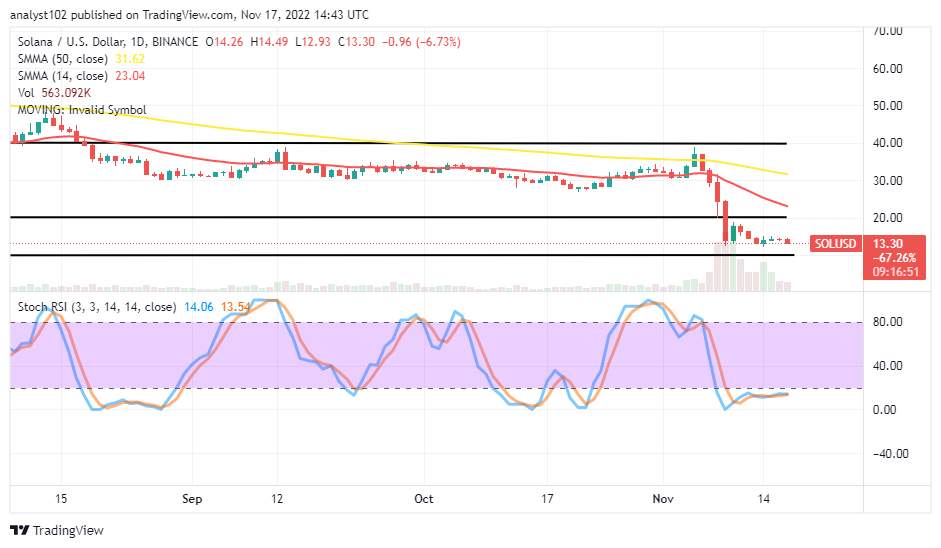
As there have been significant fall-offs in the ability of the SOL/USD trade bulls to hold back against bears’ forces has made the situation runs into a consolidation moving mode between $20 and $10 value lines. The rate of trading is kept at 6.73%, trading around the $13.30 line.
SOL/USD Market
Key Levels:
Resistance levels: $20, $25, $30
Support levels: $10, $7.50, $5
SOL/USD – Daily Chart
The SOL/USD daily chart showcases that the SOL/USD market operation runs into a consolidation movement manner. Price is within the points of upper and lower horizontal lines of $20 and $10. The 14-day SMA indicator has bent southward, maintaining a point around $23.04, beneath the $31.62 value line of the 50-day SMA indicator. The Stochastic Oscillators are in the oversold region, keeping a clogging posture over a couple of days around 14.06 and 13.54 levels. That suggests that a decreasing force is ongoing.
Will the SOL/USD trade prolong consolidating downward outside the $10 support level?
We do not think the SOL/USD trade will extend southward past the $10 support level even in the long term as the crypto market runs into a consolidation moving pattern. The value line trading spot can serve as a rebounding zone to signify the potentiality of price, trying to make upswings in preparation.
On the downside of the technical analysis, activities in the SOL/USD market operations have to be under the control of bears, keeping the force below the $20 upper resistance range line if the bulls will still not have the energy to push through the resistances. In the meantime, price movements have every signal tendency to feature for some time as it has been. 
SOL/BTC Price Analysis
In comparison, Solana remains under a depression setting against the trending ability of Bitcoin. The cryptocurrency pair market runs into a consolidation moving manner below the trend lines of the SMAs. The placement of the 14-day SMA indicator underneath the 50-day SMA indicator signifies the pairing crypto market is still wallowing in the depth of the lower-trading spot. The Stochastic Oscillators are dipped into the oversold region, consolidating around 13.02 and 12.35 levels.
Note: Cryptosignals.org is not a financial advisor. Do your research before investing your funds in any financial asset or presented product or event. We are not responsible for your investing results.
You can purchase Lucky Block here. Buy LBLOCK