Solana (SOL/USD) Price Prolongs Lower Lows in $20 and $10
Estimated Reading Time: 3 minutes
Don’t invest unless you’re prepared to lose all the money you invest. This is a high-risk investment and you are unlikely to be protected if something goes wrong. Take 2 minutes to learn more
Solana Price Prediction – December 9
Buying moments that ought to have swung northwardly are yet to come as expected in the SOL/USD market operations as the crypto-economic price prolongs lower lows in the $20 and $10 trading lines. As of the time of writing this analysis, the crypto trades at $13.68 at a positive percentage rate of 1.33.
SOL/USD Market
Key Levels:
Resistance levels: $20, $25, $30
Support levels: $10, $7.50, $5
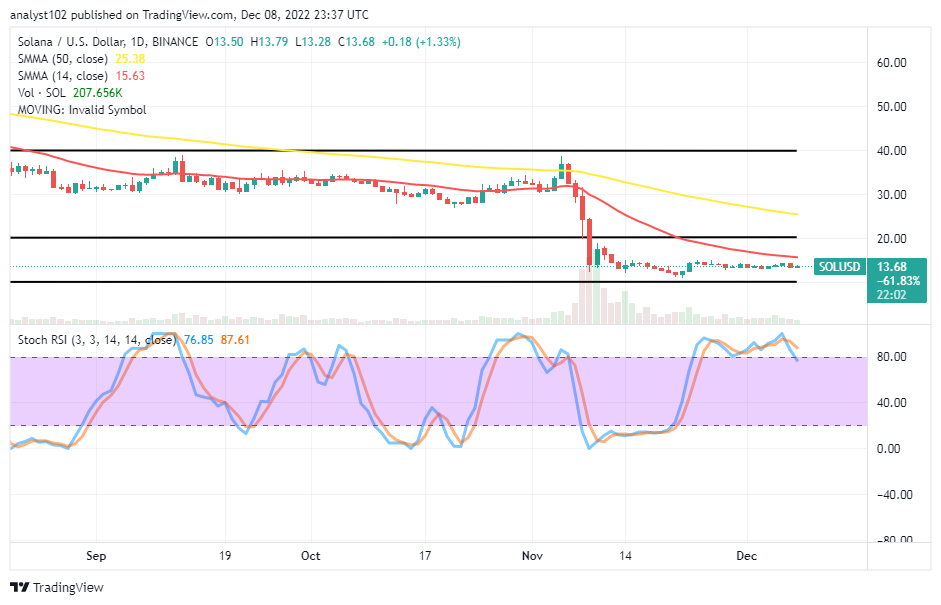
SOL/USD – Daily Chart
The SOL/USD daily chart output signals that the crypto’s price prolongs lower lows in the $20 and $10 trading levels. The 14-day SMA indicator is at $15.63, underneath the $25.38 value line of the 50-day SMA indicator. The Stochastic Oscillators have been moving in a series of consolidation-moving patterns lately. But, they have relatively crossed their lines southbound from the overbought region to 87.61 and 76.85 levels, indicating that there may soon be a depreciation in the stance of the former trading instrument.
What is the current likelihood that the price of SOL/USD will rise?
The current probability that the SOL/USD price will appreciate appears not to be observed in the near time as the crypto’s price prolongs lower lows in the $20 and $10 trading levels. At the moment, the reading of the Stochastic Oscillators pinpoints a risk of seeing the market going down more below the value of the 14-day SMA trading indicator. But, the motion might not be to place the trading situation under for further depressions at the lower level.
On the downside of the technical analysis, the momentum capacity to add more weights to any possible breakout at the $20 upper range line isn’t in a better form to produce sustainable upward forces afterward. However, sellers have neither had a better trading bearish candlestick nor a decent declining move to attract a sell entry position over time. A falling force may get intense against the $10 lower line purposely to give back a rebounding movement.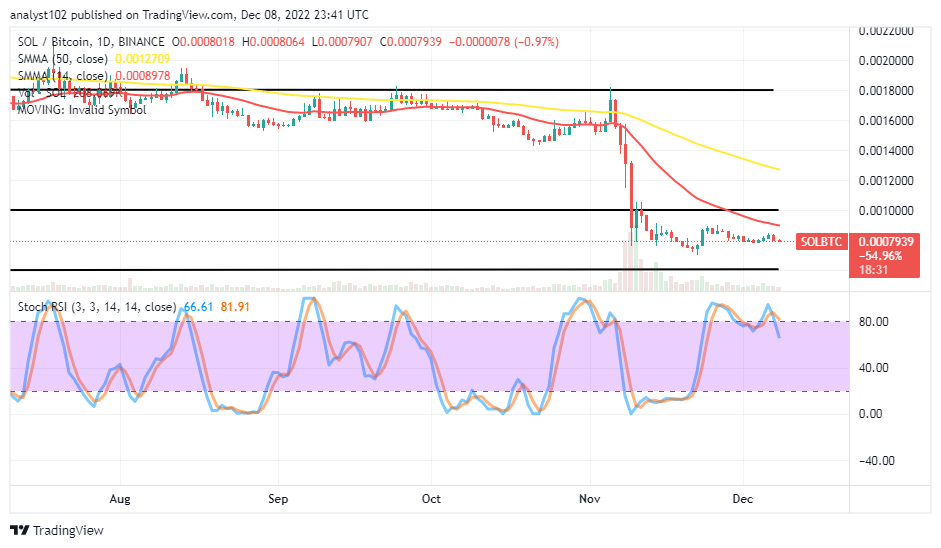
SOL/BTC Price Analysis
Solana’s trending outlook has continued to place it under selling pressure, pairing with Bitcoin. The dropping pace has been that pairing cryptocurrency price prolongs lower lows in well-defined range-bound zones below the smaller SMA trend line. The 14-day SMA indicator has bent southward apart underneath the 50-day SMA indicator. The Stochastic Oscillators are somewhat positioned southbound at 8191 and 66.61 levels. That indicates the counter-trading crypto stands a firmer prevalence chance to press downward against the force of the base crypto coin.
Note: Cryptosignals.org is not a financial advisor. Do your research before investing your funds in any financial asset or presented product or event. We are not responsible for your investing results.
You can purchase Lucky Block here. Buy LBLOCK