Solana (SOL/USD) Trade Is Peaking, Averaging $34
Estimated Reading Time: 3 minutes
Don’t invest unless you’re prepared to lose all the money you invest. This is a high-risk investment and you are unlikely to be protected if something goes wrong. Take 2 minutes to learn more
Solana Price Prediction – October 27
A series of movements, representing upsurges, have shown up in the business operations of Solana versus the US coin, given that the crypto-economic trade has been peaking, averaging the resistance line of $34.
The outlook for the transaction line has continued to be unreliable, indicating a prompt return to selling moments. Nonetheless, it is advisable to reconsider implementing new position orders. Traders should exercise caution while looking for a pattern or formation that indicates a strong future course.
SOL/USD Market
Key Levels:.
Resistance levels:$34, $36, $38
Support levels: $28, $26, $24
SOL/USD – Daily Chart
The SOL/USD daily chart showcases that the crypto-economic trade is peaking alongside the northward way of the upper Bollinger Band, averaging resistance of $34.
The following trade values are seen to represent the Bollinger Bands: $34.27, $25.92, and the lower part of $17.56 in the arrangement. The stochastic oscillators are positioned from 77.05 to 81.44. Though the formation of candlesticks has remained portending, the maximal strength of bulls is still being held to a reasonable length.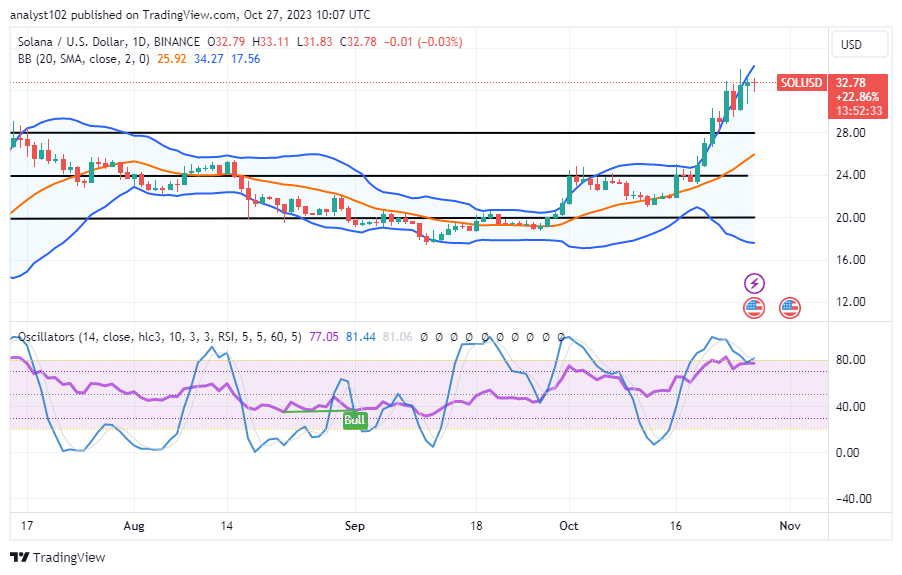
How long before bearish SOL/USD trade operations push back against the current degree of valuation?
It might still take a while even though there has been an overbought condition in the business activities of the SOL/USD, given that the crypto-economic trade is peaking at a maximal rate alongside the upper Bollinger Band, averaging the resistance line of %34.
Buyers would have to strategically keep on looking for a pull-down movement tending to regain its strength with active force to play alongside back to the upside direction. The critical support zone for gaining back has been seen at $25.92, which is the value of the middle Bollinger Band.
Bearish-trending operations are being expected to commence purposely to cause a correctional line in the present valuation of the crypto economy. Resistance lines of around $34 will probably be the real-time spot to recoup the stance against the bulls.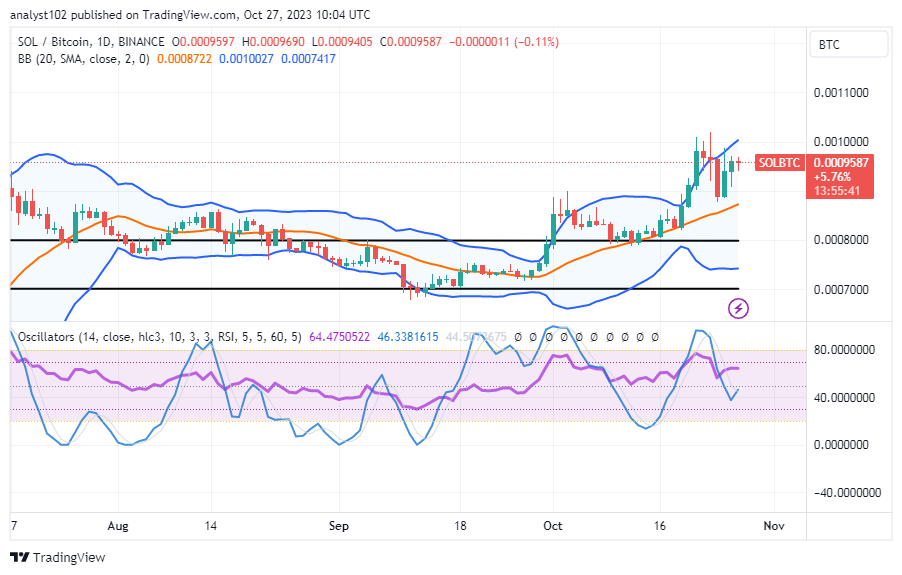
SOL/BTC Price Analysis
In contrast, Solana trade has been peaking alongside the trend line of the upper Bollinger Band against the US currency, averaging a near-crucial resistance line from the extreme higher end of the indicator.
The trend lines of the Bollinger Bands are oriented northward, and there are variations in the candlestick patterns around the upper side. Retracement processes may resume if there is a reversal of the upward movements that are attempting to break through the middle region of the indicator. The values of the stochastic oscillators have moved southward, from 64.4750522 to 46.3381615.
Note: Cryptosignals.org is not a financial advisor. Do your research before investing your funds in any financial asset or presented product or event. We are not responsible for your investing results.
You can purchase Lucky Block here. Buy LBLOCK