Synthetix (SNXUSD) Lurks in the Overbought Region.
Estimated Reading Time: 2 minutes
Don’t invest unless you’re prepared to lose all the money you invest. This is a high-risk investment and you are unlikely to be protected if something goes wrong. Take 2 minutes to learn more

Free Crypto Signals Channel
SNXUSD Analysis: The Market Lurks in an Overbought Region
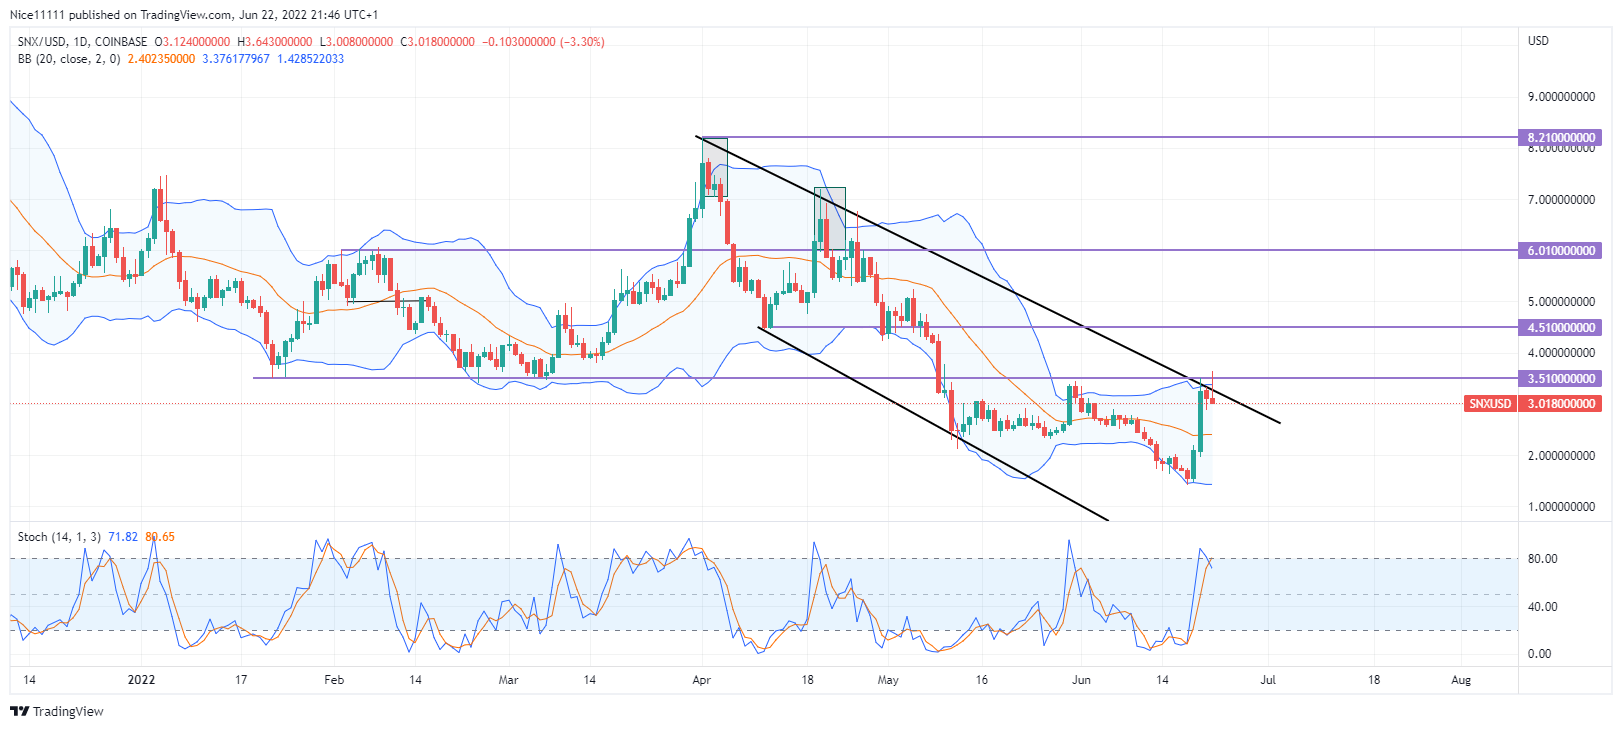
SNXUSD lurks in an overbought region on the daily timeframe. The market has reached the upper limit of the descending channel.
SNXUSD Major Zones
Supply Zones: $8.2100, $0.6010
Demand Zones: $4.510, $3.510
SNXUSD has been bearish since the beginning of April. The market was in consolidation from late January into March. The current bearish trend was initiated with manipulation to the upside at the closing of March. The market peaked at $0.8210 in the overbought region before it started crashing. The Stochastic indicated that the market was ready for a selloff. The bullish candles pressed into the Bollinger band on the upper side as March ended. A swing high was formed, resulting in a downward displacement.
A significant swing low was formed at $0.4510. The swing low was lower than the previous one, indicating a change in the market trend. The swing low was used to go long to $0.6010, which was in the overbought region. The Bollinger Bands acted as resistance as the Stochastic indicated the market was in the overbought region. A double top was formed. This led to a displacement that violated the demand level at $3.510. The market has also soared above the Moving Average of the Bollinger Bands into the upper side. The market is again in the oversold region, as seen on the Stochastic indicator.

Market Expectations
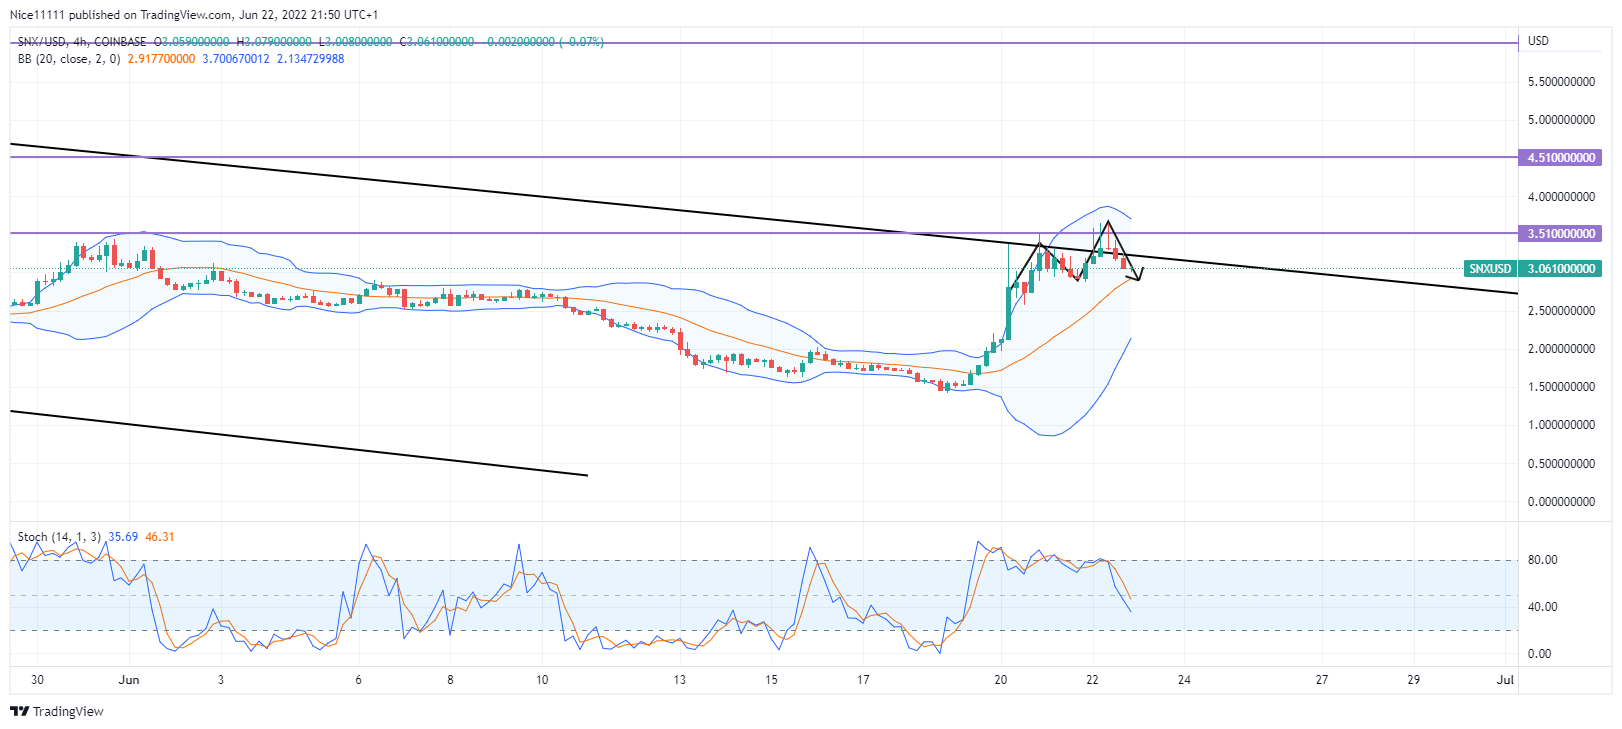
The previous demand level at $3.510 is currently acting as resistance. The previous demand level had stopped bullish moves during the last week of May. The market reached the upper limit of the descending channel. A double top bearish reversal pattern has formed. The bears are likely to go short at $3.510.
How To Buy Lucky Block
Note: Cryptosignals.org is not a financial advisor. Do your research before investing your funds in any financial asset or presented product or event. We are not responsible for your investing results.