Top Trending Coins for Today, April 15: ARB, ID, BTC, FTT, and SHIB
Estimated Reading Time: 5 minutes
Don’t invest unless you’re prepared to lose all the money you invest. This is a high-risk investment and you are unlikely to be protected if something goes wrong. Take 2 minutes to learn more

Across the top 5 trending coins for this week, after the price retracement, we noticed that the markets were going into a price consolidation trend. The bulls of the respective markets drove the prices into the various overbought territories. For most of these markets, the price consolidation takes place above the 20-day moving average. This trend will allow the bulls to secure a firm grip on the demand level so that they can prepare the market for more bullish action. Some of the trending coins are newcomers, and their performances are not bad.
Arbitrum (ARB)
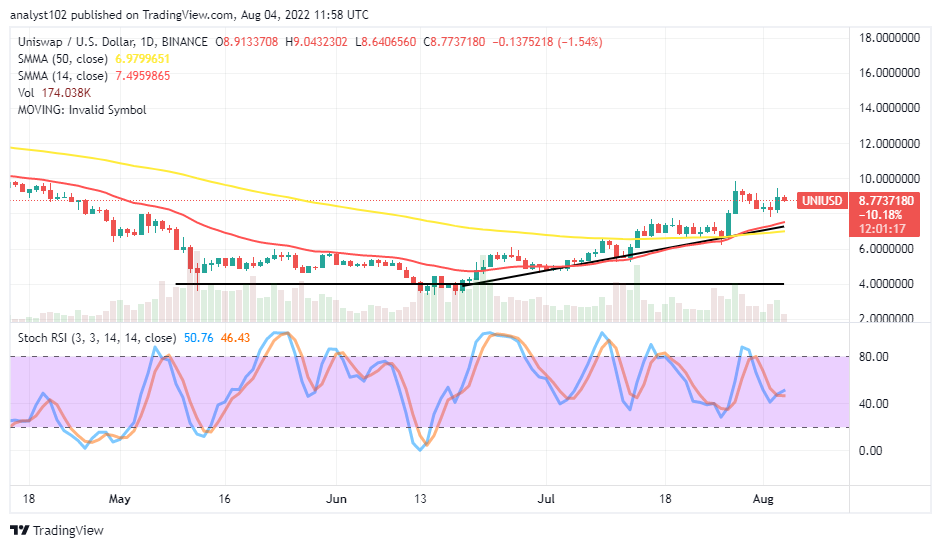
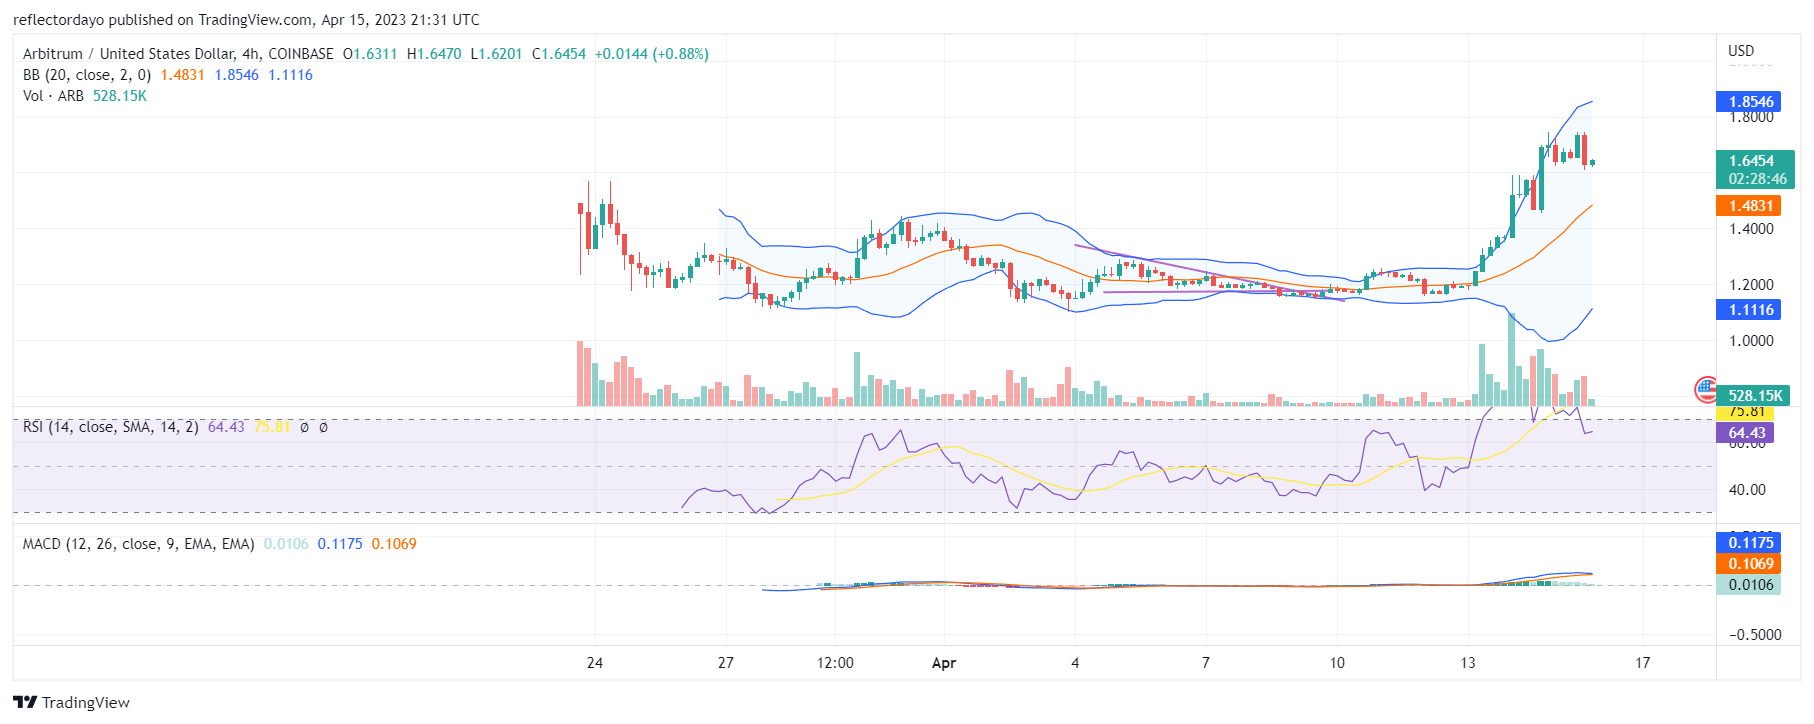
Arbitrum’s performance in the past few weeks has not been too bad for a new market such as this one. It is at the top of the rankings for this week. Although in the past 24 hours it has dropped by almost 5%, it still maintains its top rank. This week, the price has continued to rise due to massive buying. Although the Bollinger Bands indicator points to high volatility, the bulls continue to dominate the market for most of the week. After hitting the $1.72 price level, the bull market takes a recess, securing new support at $1.63. According to the Relative Strength Index (RSI), continuous bullish activity made the market linger in the overbought region for a while before it corrected itself. There is a greater likelihood that the bullish trend will continue after this sideways market action.
Current Price: $1.64
Market Capitalization: $2,079,030,462
Trading Volume: $1,711,184,690
Space ID (ID)
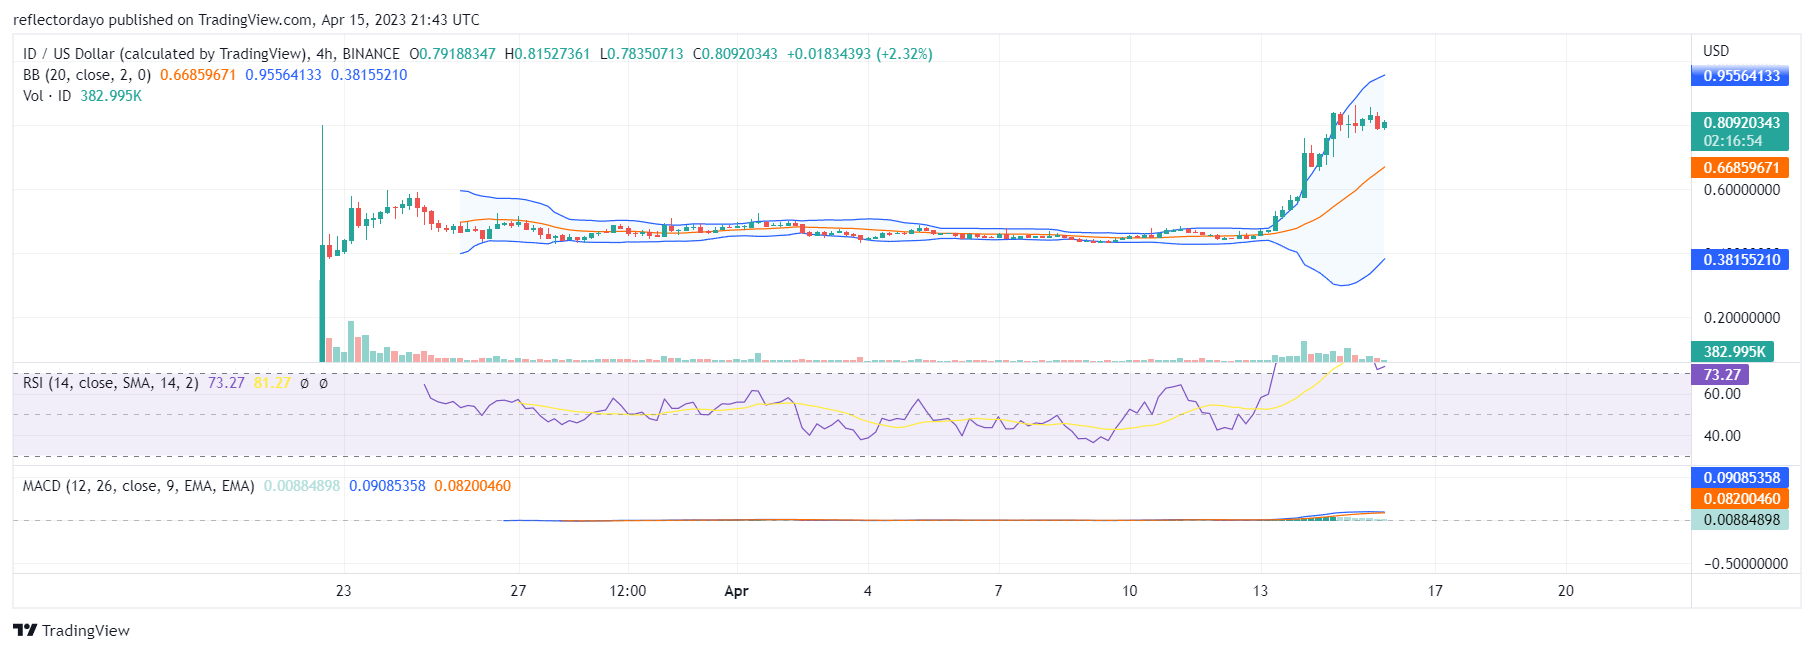
This market is quite similar to the Arbitrum market. It is also a newcomer and has a similar bullish performance to the Arbitrum market. However, in the past 24 hours, it has also seen a slight decline in price of 2.74%, but its gain for seven days has been 77.45%. The market hit a psychological level at the $0.842 price, and traders began to take their profit. However, the bullish force behind the trend has kept the market strong at the $0.80 price level. A source of concern is the fact that according to the Relative Strength Index, the market is currently overbought, with its price retracement still above the 70-level mark. There are two possibilities: either the price continues to consolidate for a while or the bears turn the market around. But if the price continues to consolidate, keeping a firm grip on the support level, the uptrend can later continue.
Current Price: $0.8092
Market Capitalization: $225,690,497
Trading Volume: $658,230,732
Bitcoin (BTC)
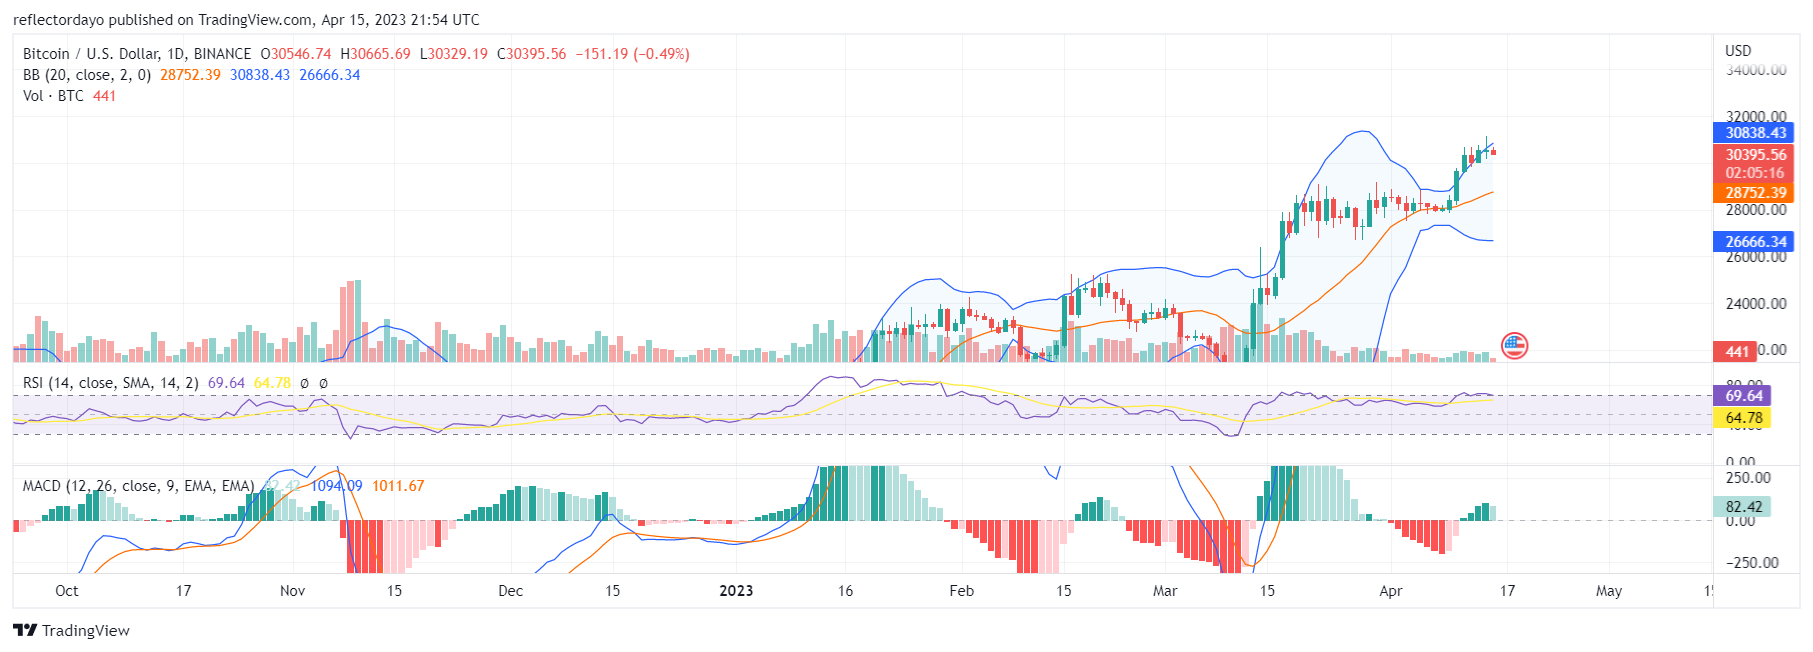
The Bitcoin market is trying to establish a strong footing in the $30,000 zone. The market hit this $30,000 level on April 11, and since then it has been experiencing a demand and supply faceoff, making the price oscillate around this price level. Currently, the $31,000 resistance level is proving to be quite a hindrance to the progress of the bull market. Likewise, the $30,000 price level shows the prospect of being a strong support for the bull market. We might likely see more bullish action in this market in the coming week as the bullish momentum, according to the Relative Strength Index (RSI), is very high. The RSI line measures at level 69.
Current Price: $30,339
Market Capitalization: $586,987,444,027
Trading Volume: $12,495,766,100
FTX Token (FTT)
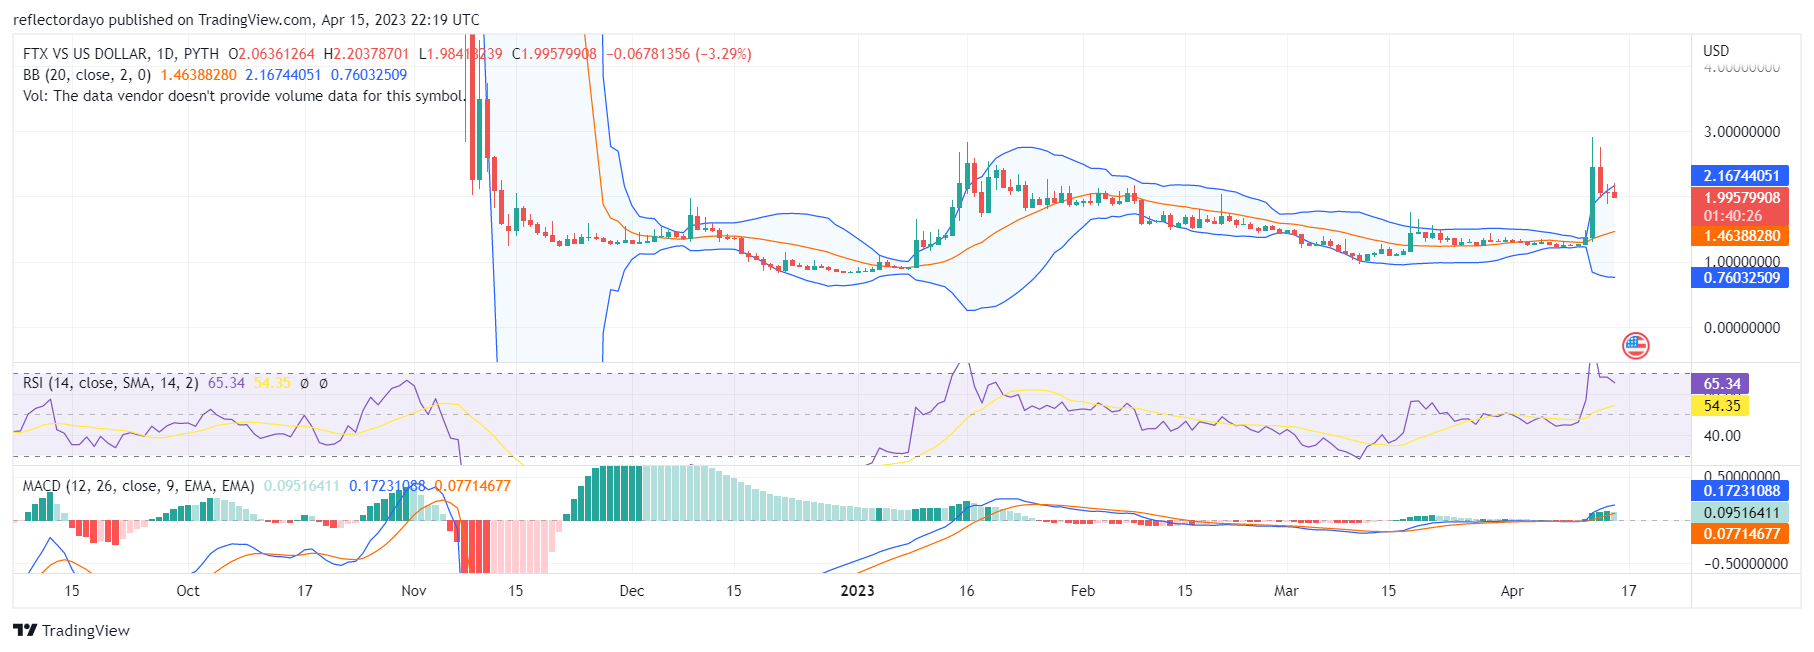
The FTX market has been sideways for a while, from the second half of the match until April 11, when it started pumping furiously. This bullish market reached near the edge of the $3.00 price level before settling at the $2.00 price level. The bulls are trying to secure $2.00 as a strong base for more action. If buyers can do this, then they will be conserving a handsome amount of the bullish price. However, a source of concern is whether bulls will be able to do that due to the high volatility. The Bollinger Bands expand strongly, signifying that the bears are also formidable.
Current Price: $2.1674
Market Capitalization: $660,401,109
Trading Volume: $46,276,081
Shiba Inu (SHIB)
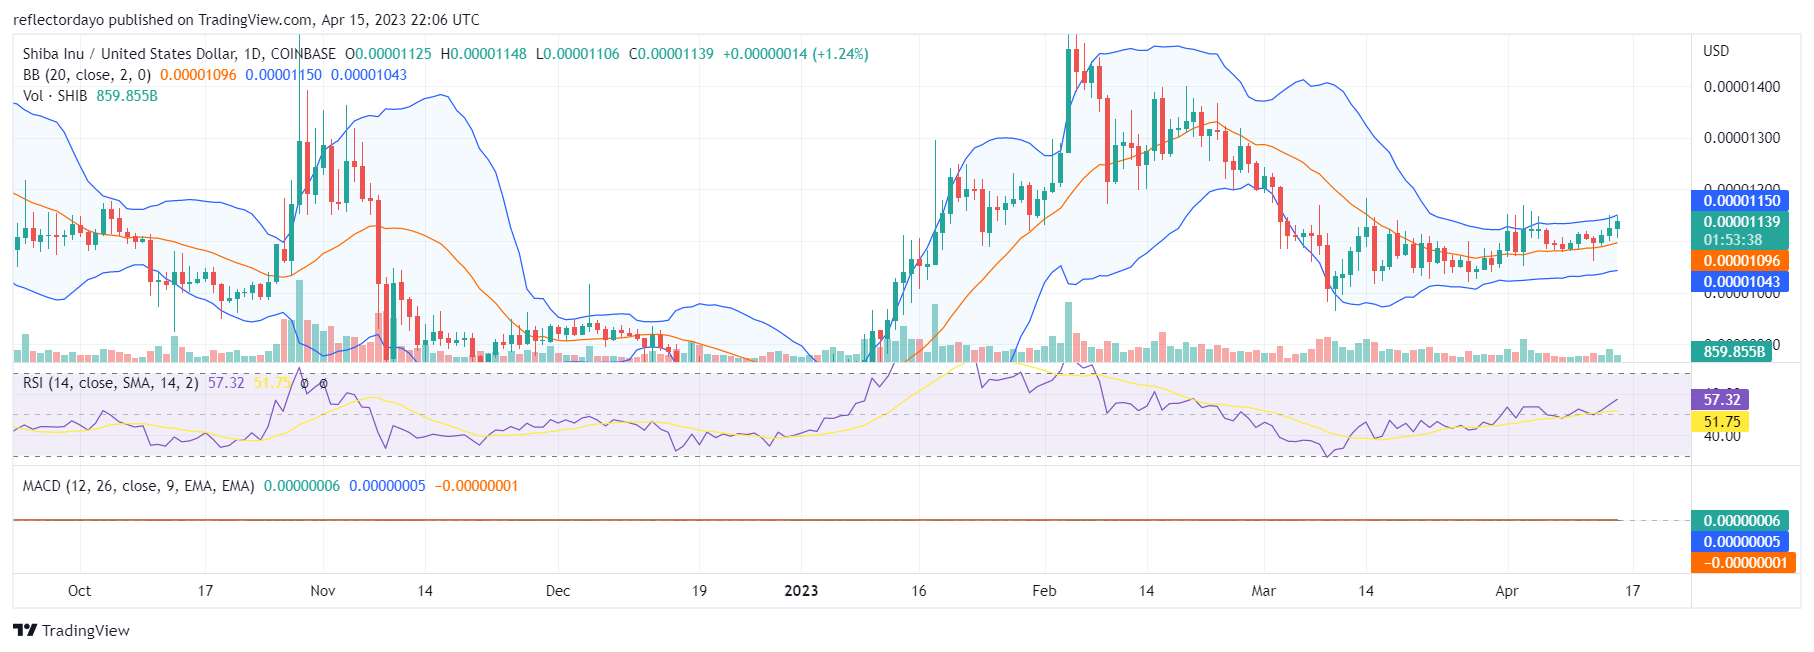
The SHIB market is in a steady bullish trend, judging by the higher lows shown on the chart. According to the Relative Strength Index (RSI), the rise of the SHIB price is a slow and steady one, as the market started the upside movement on March 10. All through that time, the market has maintained the same resistance level while the support level has continued to change, thereby putting pressure on the supply level. In early April, the SHIB market tested the $0.00001164 price level several times. The market also saw a few spinning tops at the resistance, pointing to intense struggle around this area. Finally, today’s market has launched the price above the resistance level.
Current Price: $0.00001136
Market Capitalization: $6,696,547,172
Trading Volume: $210,179,623
Would you like to advance your trading to a new level? Participate in Dash 2 Trade. Buy Dash 2 Trade (D2TUSD) now!