UMA (UMAUSD) Confined to a Ranging Movement
Estimated Reading Time: 2 minutes
Don’t invest unless you’re prepared to lose all the money you invest. This is a high-risk investment and you are unlikely to be protected if something goes wrong. Take 2 minutes to learn more
UMAUSD Key Zones
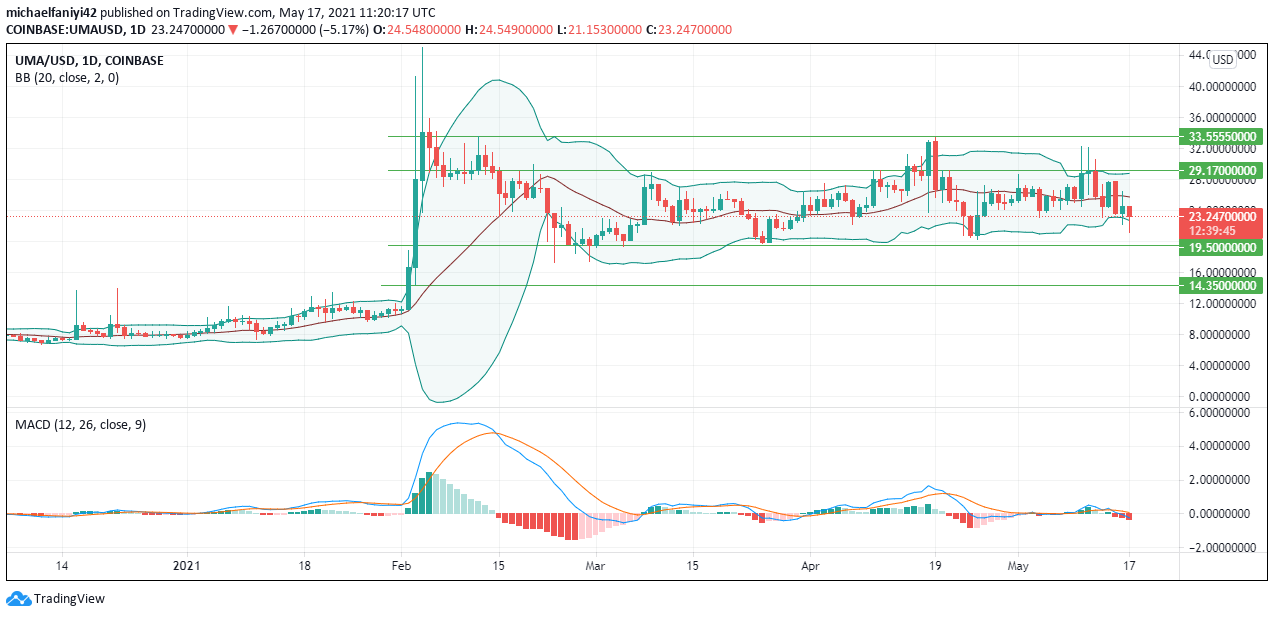
Resistance Zones: 33.555, 29.170
Support Zones: 19.500, 14.350
UMAUSD has continued in its consolidation phase. Neither seller nor buyers are acting on the market. The last major move of the price was on the 2nd of February, 2021. Price spiked up from its initial resistance at 14.350 to more than 45.000, which is at a 214% increase. There was an immediate correction in the space of 4 days. Since then, the 33.555 resistance has shielded the price from going higher. Price fell back to the support at 19.500, and it has since been moving back and forth in a sideways trend with 29.170 first and then 33.555 as resistance.
UMA is set to continue ranging sideways as there is no bias to go long or short. From previous price action, the price was in a similar consolidation phase from 20th September 2020 to 2nd February 2021 when it spiked up suddenly.
The Bollinger Band indicator is compressed. This shows a quiet market. The indicator also acts as dynamic supply and demand lines to price in the ranging market. Traders can employ the Bollinger Bounce strategy by going short at the upper line and going long at the lower line.
An alternating pattern of histogram bars showing buying and selling can be detected on the MACD (Moving Average Convergence Divergence). This also points to a sideways trending market. The MACD helps to detect the market direction by showing increasing or decreasing heights of histogram bars. The MACD currently shows a bearish bar and the price might just be on the verge of reversing.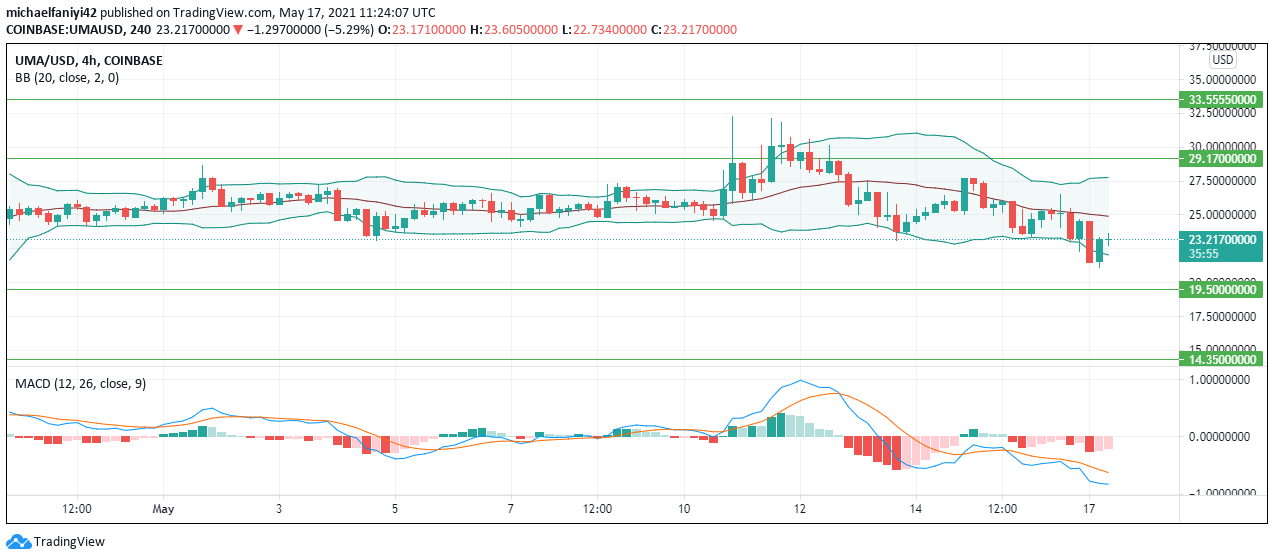
The candlesticks are already on the lower line of the Bollinger Band indicator on the 4-hour time-frame. The candlestick is bearish showing an upturn in price already. Traders should however be conscious of the middle line of the Bollinger Band indicator which acts as a supply/demand for the price.
The MACD indicator is displaying a fading bearish histogram bars to show that price might already be changing direction.
Note: cryptosignals.org is not a financial advisor. Do your research before investing your funds in any financial asset or presented product or event. We are not responsible for your investing results.