UMA (UMAUSD) Forms an Ascending Triangle to Move Up
Estimated Reading Time: 3 minutes
Don’t invest unless you’re prepared to lose all the money you invest. This is a high-risk investment and you are unlikely to be protected if something goes wrong. Take 2 minutes to learn more
Market Analysis – UMA Is Set to Move up as It Forms an Ascending Triangle
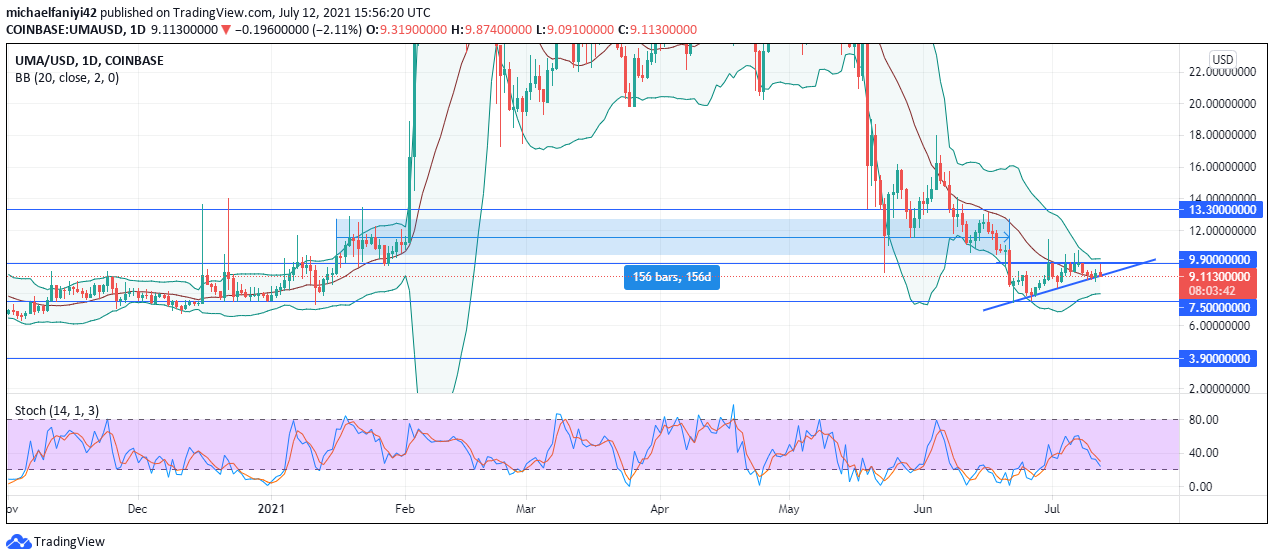
UMA forms an ascending triangle and is set to break upwards. UMAUSD has been struggling to elevate its position after a major fall in price occurred on the 19th of May 2021. It has thus far been a tussle between the bulls and the bears, with the bears having the upper hand. The market had a brief moment of consolidation between the 24th of May and the 10th of June 2021, after which prices fell further.
UMA eventually fell below the $9.900 resistance and stopped at the $7.500 support. Between these key levels is where the coin has traded between the 29th of September 2020 and the 16th of January 2021, after which there was a high market surge that lifted the market out of this zone. After 156 trading days, the market has returned to familiar surroundings. However, UMA has been making efforts to lift itself out of the zone again.
The market has gradually tapered up and therefore forms an ascending triangle. The candlesticks are cranking between the $9.900 resistance and the lower uptrend line. This is also confirmed by the Stochastic oscillator whose signal lines are currently plunging as a result of a crash against the uptrend line. The Bollinger Band has its middle line resisting the market as it falls but has not switched positions to support the candles for a move up.
UMA Key Zones
Resistance Zones: $13.300, $9.900
Support Zones: $7.500, $3.900
Market Anticipation
On the 30th of June 2021, the coin spiked out of the zone and fell back instantly. This also happened on the 4th, 6th, and 7th of July 2021. This shows the bullish agitations of the coin as it tapers upwards.
Currently, UMA has crashed to the uptrend line and a bullish candle has been formed for another upward round. The middle line of the Bollinger Band is in support of the market for bullish movements.
The market is expected to eventually break out and reach the $13.300 key level.
You can purchase crypto coins here. Buy Tokens
Note: Cryptosignal.org is not a financial advisor. Do your research before investing your funds in any financial asset or presented product or event. We are not responsible for your investing results.