UMA (UMAUSD) Maintains a Silent Market
Estimated Reading Time: 2 minutes
Don’t invest unless you’re prepared to lose all the money you invest. This is a high-risk investment and you are unlikely to be protected if something goes wrong. Take 2 minutes to learn more

Free Crypto Signals Channel
UMA Analysis – The Price Maintains a Silent Movement
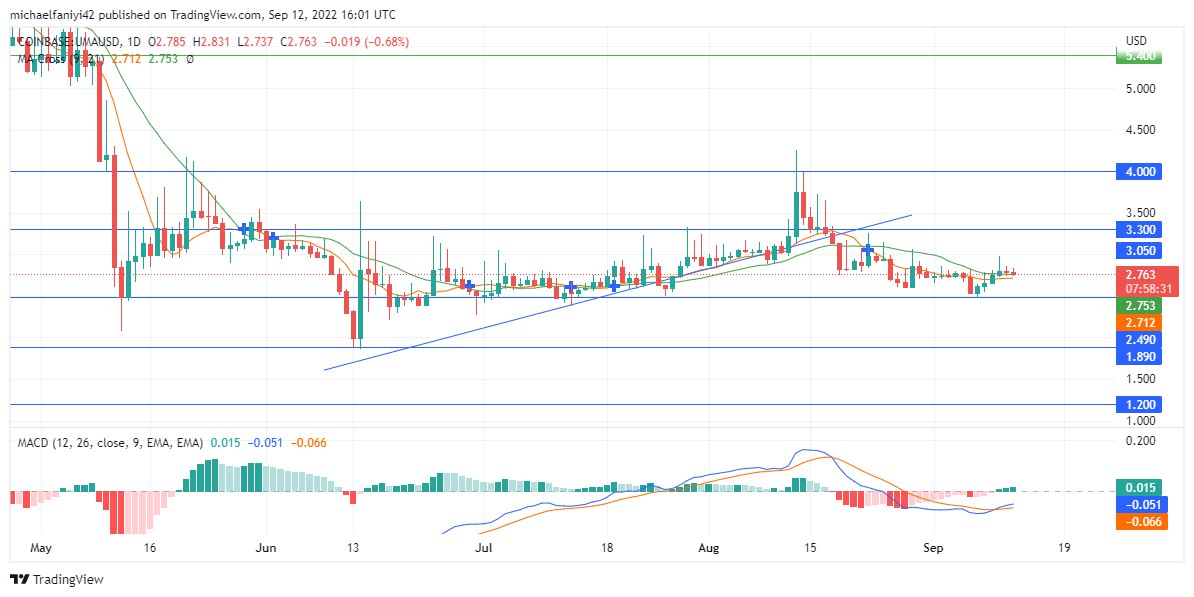
UMA maintains a silent market momentum amidst a tendency to push for higher price levels. A setback befalls the market in recently in which it fails to hold above the $3.300 price level. Despite this, a major positive is that the coin maintains its standing above $2.490, thereby recording a higher low. Despite the silent market, UMA is silently push for a rise after bouncing off the $2.490 support.
UMA Key Support Levels
Resistance Levels: $3.300, 4.000
Support Levels: $2.490, $1.890
UMA has been trying to recover itself after a series of bearish bouts. Its first attempt was to consolidate itself between the $3.300 key level and a rising trend line. Things gradually went according to plan and by the 12th of August, there was a breakout upward. This lifted the price above $4.000, but then the coin came to settle above $3.300. Even at that, the market did not last long at that key level
By the 17th to the 18th of August, UMA slides below that $3.300 key level and back to $2.490 where it rose from. The market then maintains its course there to generally record a new higher low and it starts pushing The MACD (Moving Average Convergence Divergence) lines have crossed each other below the zero level and green histogram bars are already emerging.
 Market Expectation
 Market Expectation
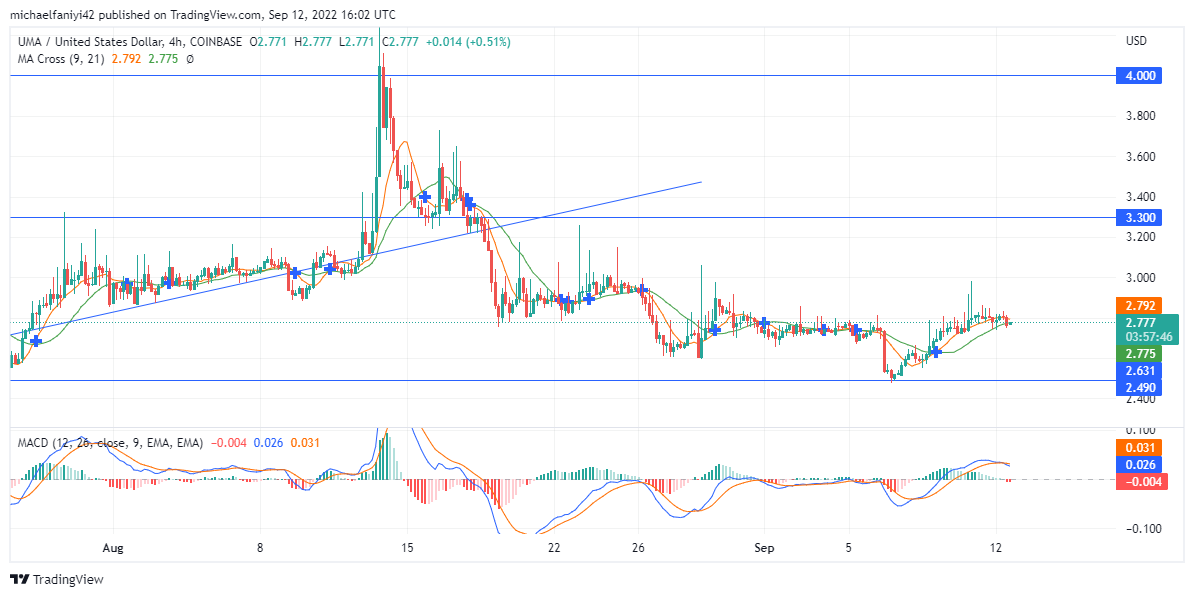
The 4-hour chart suggests that while UMA maintains a silent momentum, the price could be on the rise again after springing off the $2.490 key level. While the MA Cross (Moving Average)is yet to cross upward on the daily chart, there is already an upward cross on the 4hour chart. Also the MACD lines have cross above the zero line on the 4hour chart. The buyers will be gearing to test the $3.300 line.
You can purchase Lucky Block here. Buy LBLOCK
Note: Cryptosignals.org is not a financial advisor. Do your research before investing your funds in any financial asset or presented product or event. We are not responsible for your investing results.