Uniswap (UNI/USD) Market Continues Declining
Estimated Reading Time: 3 minutes
Don’t invest unless you’re prepared to lose all the money you invest. This is a high-risk investment and you are unlikely to be protected if something goes wrong. Take 2 minutes to learn more

Free Crypto Signals Channel
Uniswap Price Prediction – February 24
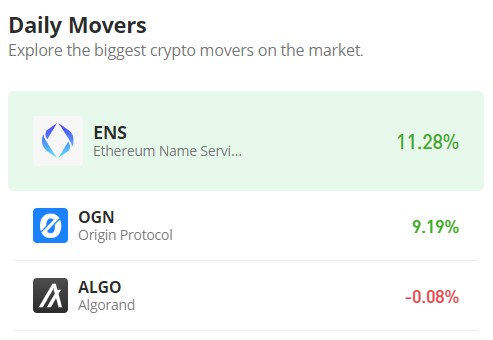
There has been a prolonged prevalence of a bearish downtrend in the UNI/USD trading operations as the crypto-economic market continues declining in its valuation. The percentage rate of the crypto’s price against the US dollar is at about 11.09, trading around $7.
UNI/USD Market
Key Levels:
Resistance levels: $10, $12, $14
Support levels: $6, $4, $2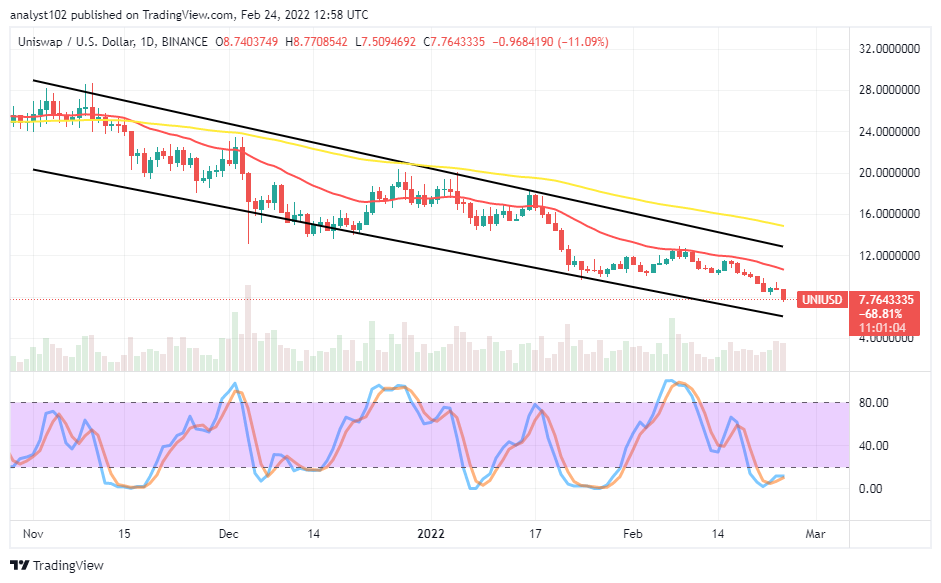 UNI/USD – Daily Chart
The UNI/USD daily chart reveals that the crypto-economic market continues declining in a slow-and-steady moving manner underneath the sell signal side of the smaller SMA. The 50-day SMA indicator is above the 14-day SMA indicator. Variant bearish candlesticks toward the lower bearish channel trend line drawn. And that showcases the downward forces are intense. The Stochastic Oscillators are currently in the oversold region. A bearish candlestick appears in the making to denote that the crypto economy witnesses a falling force.
Will the UNI/USD price dip more as the crypto-economic market continues declining?
There is a tendency that the UNI/USD price will still go dipping as the crypto-economic market continues declining over time in a slow-and-steady moving manner. Being as it is, long-position placers will have to be patient, especially those intended to trade on a short-term approaching basis. However, the current trading level could be a good buying time for long-term traders and intending investors to consider conjoining the market now.
On the downside of the technical analysis, the UNI/USD market short-position placers needed to be wary of exerting new orders at or around the current trading value-line as the position opened at that level can run into being caged in no time. Consolidation of price around the current price line underneath the trend line of the 14-day SMA may lead to finding support around the $6. But, it is not technically too good to count upon any emanating thereof.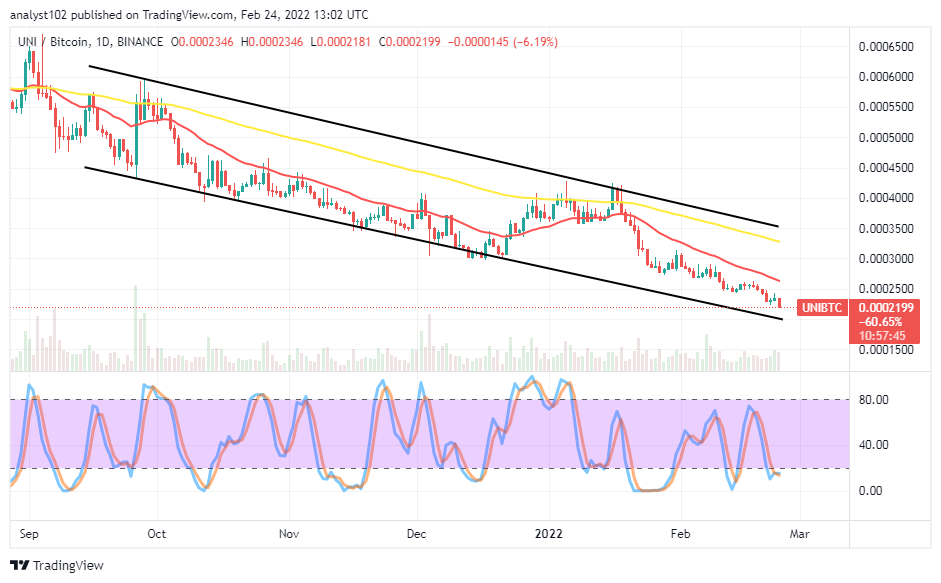
UNI/BTC Price Analysis
In comparison, Uniswap has remained running under a falling force inflicted upon it by Bitcoin over time until the present. The bearish channel trend lines drew to enclose the SMAs, purposely to signify the pace at which the cryptocurrency pair market continues declining. The 14-day SMA indicator is beneath the 50-day SMA indicator. The Stochastic Oscillators are in the oversold region, suggesting that the base crypto may soon garner the energy to push back against the flagship counter crypto’s trending capacity.
Note: Cryptosignals.org is not a financial advisor. Do your research before investing your funds in any financial asset or presented product or event. We are not responsible for your investing results.
You can purchase Lucky Block here. Buy LBlock: