Uniswap (UNI/USD) Price Hits Resistance at $20
Estimated Reading Time: 3 minutes
Don’t invest unless you’re prepared to lose all the money you invest. This is a high-risk investment and you are unlikely to be protected if something goes wrong. Take 2 minutes to learn more
Uniswap Price Prediction – July 1
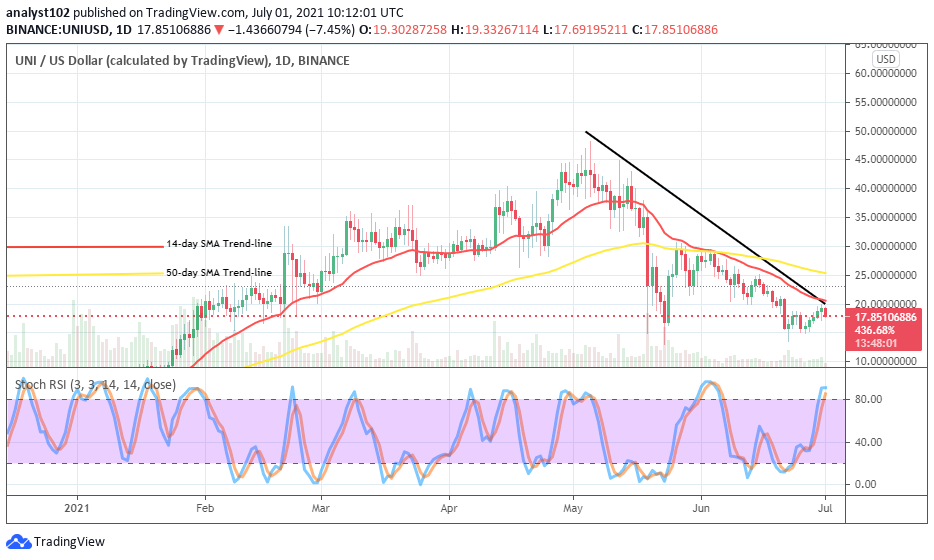
Recently, the market worth of UNI/USD hits a resistance around the level of $20 while it strived to surge northward. The market’s percentage rate is around -7.1, trading at the level of about $17 as of writing.
UNI/USD Market
Key Levels:
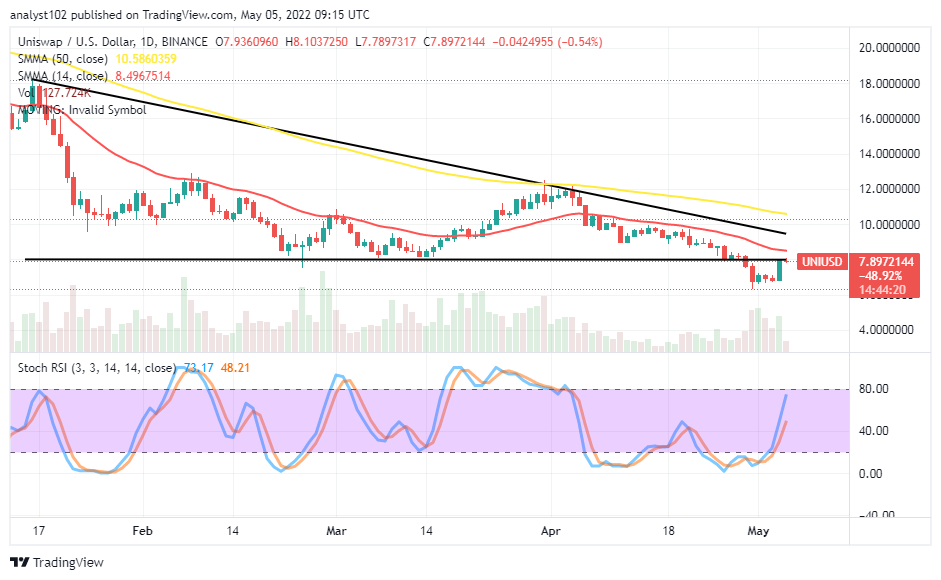
Resistance levels: $20, $25, $30
Support levels: $15, $10, $5
UNI/USD – Daily Chart
The UNI/USD daily chart depicts that there may soon be a bearish trend continuation as the price hits a resistance around the point of $20 during yesterday’s session. Today’s operation has begun to witness a downward motion on a lighter note. The 50-day SMA indicator is above the 14-day SMA trend-line. The bearish trend-line drew downward across the bigger SMA to conjointly meet with the smaller SMA at a tail end around the resistance level of $20. The Stochastic Oscillators are a bit over range 80 in the overbought region. That testifies to the possibility of seeing the market not pushing up smoothly in the near time.
Will there soon be a breakout at the resistance level of $20?
As there has been an emergence of a bearish still being formed a bit below the resistance level of $20 during today’s session, the UNI/USD may go down further on a slow and steady motion in the next session. Unless, if the crypto trade turns otherwise to feature a violent bearish reversal move that could breakout at the point earlier mentioned. However, in the meantime, the current trading station well seems to be one of the best buying levels of the market. Bulls are only to let their position run on a long-term.
On the downside, the market level at $20 has to be another notable point that bears needed to regain the momentum as price has slightly pulled up from a previous lower point. A long-hold of price at the lower end of today’s Japanese bearish trading candlestick could probably create room for more downward forces. The readings of the Stochastic Oscillators will have to be adhered to in determining the strength of direction that the crypto will come about.
UNI/BTC Price Analysis
It is depicted on the UNI/BTC price chart that the base crypto is losing the trending capability to the flagship counter crypto. The recent rallying motion made by UNI has only seemingly led to touch a resistance below the bearish trend-line that drew across the SMAs. The 50-day SMA indicator has been intercepted by the 14-day SMA trend-line. The Stochastic Oscillators are attempting closing of the lines at range 80 near into the overbought region. That portends that weakness may surface again in Uniswap’s trending capacity pairing with that of Bitcoin.
Note: new.cryptosignals.org is not a financial advisor. Do your research before investing your funds in any financial asset or presented product or event. We are not responsible for your investing results.
You can purchase crypto coins here. Buy Tokens