Uniswap (UNI/USD) Price Is Under a Pressure, Hovering Below $7
Estimated Reading Time: 3 minutes
Don’t invest unless you’re prepared to lose all the money you invest. This is a high-risk investment and you are unlikely to be protected if something goes wrong. Take 2 minutes to learn more
Uniswap Price Prediction – January 18
The trading indicators of Bollinger Bands have remained trending northward to show that the trend making ups and downs has been bullish, as the UNI/USD market is under pressure, hovering below the line of $7.
It is psychologically best to always monitor points between $6 and $5.50 in the mode that shows an upward trend, as the price is not anticipated to push southerly beneath them to place below sustainably over the long term. The stochastic oscillators seem to need to be re-positioned at a lower end to point northward in returns in order for buyers to make comebacks after a line of reductions. That suggests that a force supporting the moves to the upside needs to be maintained after that.
UNI/USD Market
Key Levels:
Resistance levels: $7.50, $8, $8.50
Support levels: $6, $5.50, $5
UNI/USD – Daily Chart
The UNI/USD daily chart showcases that the crypto-economic market is under pressure, hovering below the line of $7.
The stochastic oscillators have managed to traverse northbound across variant points into the overbought region. A number of repelling trade signs have occurred on some candlesticks closely underneath the point of $7, indicating that bulls may hold back for a while to allow a line of corrections. The Bollinger Band trend lines are placed at the top around the point of $7.50, and their lower side is kept tightly beneath the value of $6.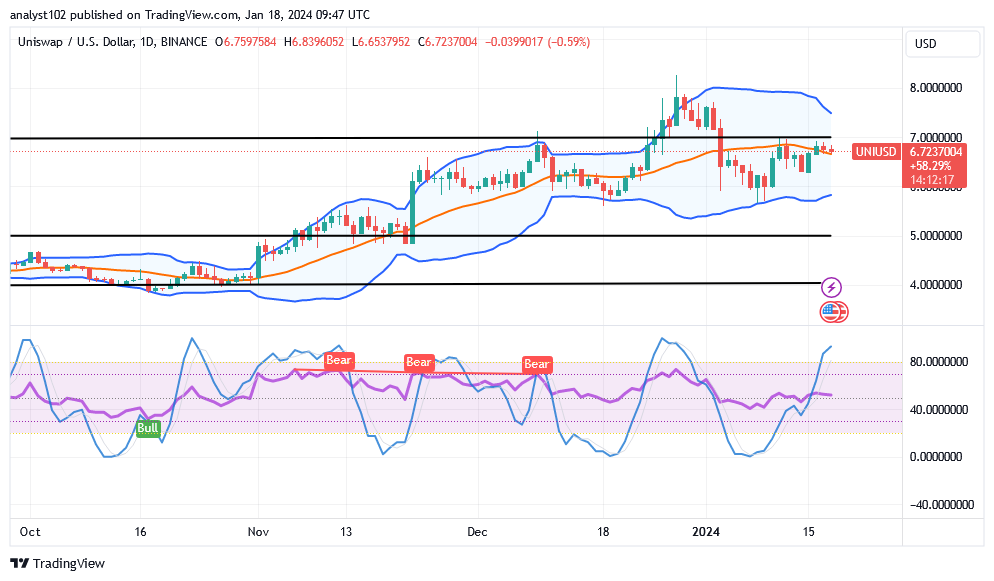
As the price trades around $6.72 or thereabouts, what market tempo capability does the UNI/USD market have?
It is likely for bulls to relax in the UNI/USD market to let there be room for firm corrections, given that the crypto-economic price is under pressure, hovering below the point of $7.
Bollinger Bands’ mid-point zone has been showing traces of minor reversions, suggesting that long-position takers could still need to hold off on initiating a rallying motion. Given the realization of that feeling, the crucial underlying support level of $5.50 should hold and not break below the lower Bollinger Band trend line’s trend point.
Points of $7 and $7.50 need not be broken steadily past the moon direction as the trade situation is currently pondering a decline after the price tends to surge from a lower position. It will take some time for sellers to determine how and when the price will be most active in favor of falling around those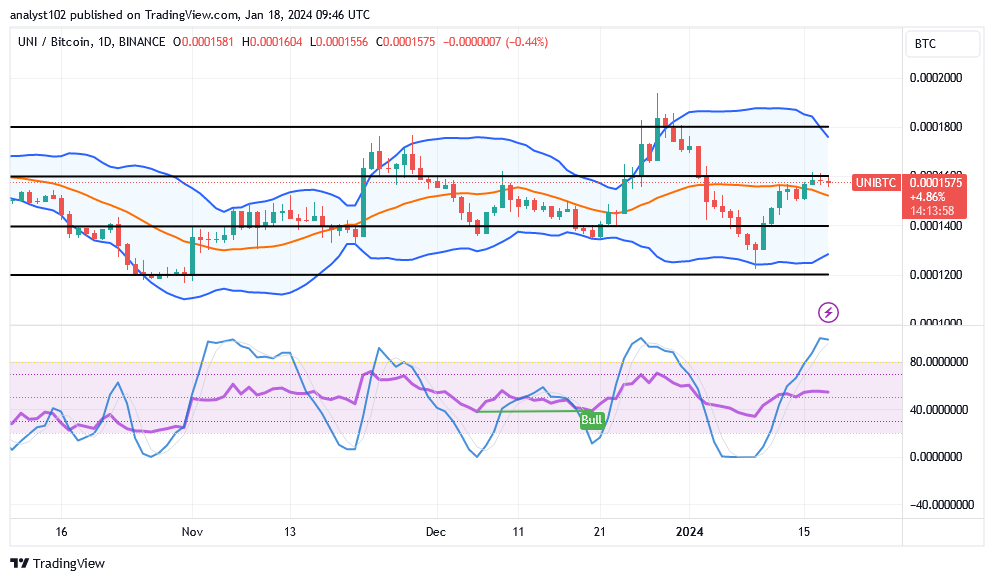
UNI/BTC Price Analysis
In contrast, the Uniswap market currently appears to be resettling toward putting itself back under declining pressure, hovering around the middle Bollinger Band.
Given that the stochastic oscillators are in the overbought area, there may be a pause in the price of the base cryptocurrency. And that can put it in a position where you see a series of downward movements. The Bollinger Bands are carefully tracking the locations of the majority of tactical climbs and falls.
\
Note: Cryptosignals.org is not a financial advisor. Do your research before investing your funds in any financial asset or presented product or event. We are not responsible for your investing results.
You can purchase Lucky Block here. Buy LBLOCK