Uniswap (UNI/USD) Price Tempts to Build Catalysts at $6
Estimated Reading Time: 3 minutes
Don’t invest unless you’re prepared to lose all the money you invest. This is a high-risk investment and you are unlikely to be protected if something goes wrong. Take 2 minutes to learn more

Free Crypto Signals Channel
 Free Telegram Channel
Uniswap Price Prediction – September 15
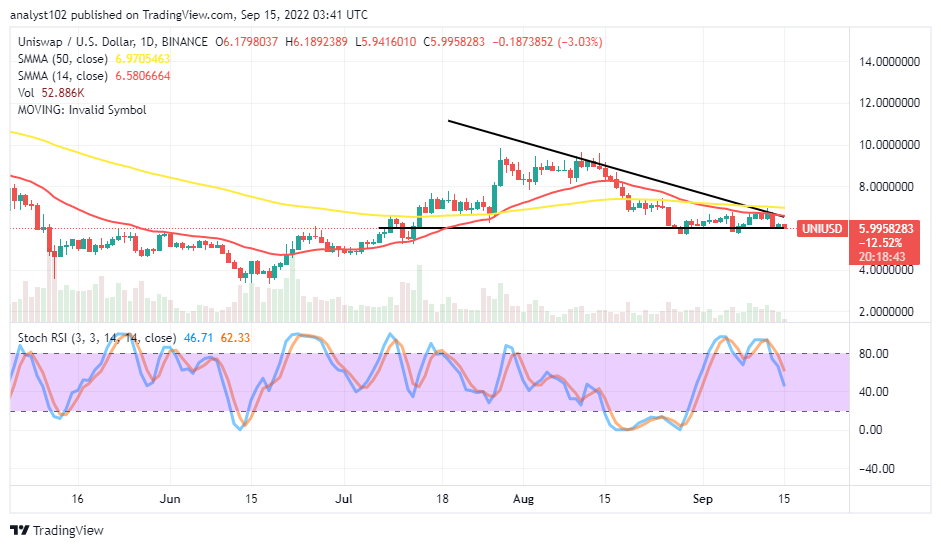
Several attempts have been made to show fluctuations of the UNI/USD trade around the $6 line as the crypto-economic price tempts to build catalysts at the value line. The last fewer hoods have produced $6.19 and $5.94 values represented as high and low of the crypto economy at an average negative percentage rate of 3.03.
UNI/USD Market
Key Levels:
Resistance levels: $7, $8, $9
Support levels: $5, $4, $3
UNI/USD – Daily Chart
The daily chart pictures that the Uniswap market price tempts to build catalysts around the $6 trading level throughout the session. The trading tools are not too far separated as the 14-day SMA indicator is at the $6.58 value line, closely underneath the $6.97 point of the 50-day SMA indicator. The horizontal line drew at the trading point to keep cognizance of the spot. The Stochastic Oscillators have curbed southbound from the overbought region, reaching 62.33 and 46.71 range points.
Is there still the chance for the UNI/USD trade to price lower below the $6 level?
Going by the reading positioning of the Stochastic Oscillators at the moment, the forces to give the downward-trending motion leverage appears to still be in focus as the UNI/USD market price tempts to build catalysts around the $6 trading level. It would be technically ideal for long-position placers to exercise the principles of cautiousness in buying orders. It may take a while before bulls can gain their well-positioning posture around the value point in question.
On the downside of the technical analysis, the UNI/USD market bears tend to still less actively push off to the downside direction below the $6 level. But, it is not psychologically worthy of following to avoid an unnecessary rebound that can as well resurface in the process. To that end, selling activities may have to suspend for now.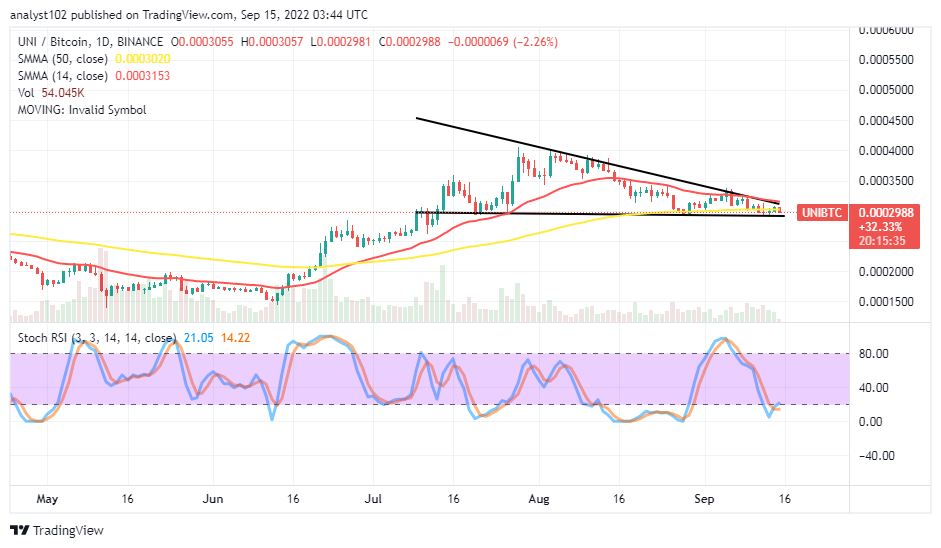
UNI/BTC Price Analysis
In comparison, the trending pressures of the Uniswap against Bitcoin have continued to feature at a high trading zone. From the technical point of view, the cryptocurrency pair market tempts to build catalysts from a lower point around the bigger SMA trend line. The 14-day SMA indicator is above the 50-day SMA indicator. The Stochastic Oscillators have moved into the oversold. And they are now trying to cross slightly northbound, staying at 14.22 and 21.05 range values.
Note: Cryptosignals.org is not a financial advisor. Do your research before investing your funds in any financial asset or presented product or event. We are not responsible for your investing results.
You can purchase Lucky Block here. Buy LBLOCK