Wall Street Memes (WSM) Price Gains, Holding Above $0.001
Estimated Reading Time: 3 minutes
Don’t invest unless you’re prepared to lose all the money you invest. This is a high-risk investment and you are unlikely to be protected if something goes wrong. Take 2 minutes to learn more

Wall Street Memes Price Prediction – February 14
The systemic southward trend that presently features in the mode of showing that bulls are losing stances slightly in the vein of trying to get a recoup of momentum, given that the WSM/USD market gains, holding above $0.001.
The lower boundary of the Bollinger Bands is gradually being approached, creating a potential environment for a rebound to take shape. This setup could signal a period of consolidation or price pauses before a significant resurgence in upward momentum materializes. The market may exhibit some range-bound movements during this phase, but once the consolidation phase concludes, the probability of a new upward leg appears to be more likely, as the bullish forces align for the next phase of growth.
WSM/USD Market
Key Levels
Resistance levels: $0.002, $0.0025, $0.003
Support levels: $0.0008, $0.0006, $0.0004
WSM/USD – 4-hour Chart
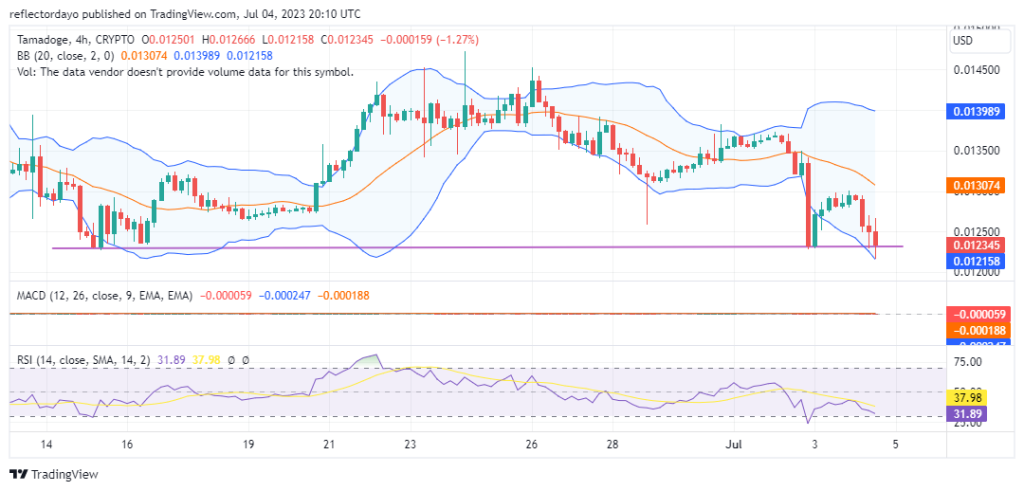
The WSM/USD market 4-hour chart showcases that the crypto-economic market gains, holding above $0.001.
The Bollinger Bands’ trend lines are currently positioned northward, with a slight baseline around $0.001. The stochastic oscillators have dipped southward, entering the oversold region, following a prolonged bullish signal.
Will the WSM/USD market’s proximity to the lower Bollinger Band result in sustained bearish pressure and further drawdowns?
If having the WSM/USD market eventually pressing harder against the lower Bollinger Band’s trend line, the presumed consequences won’t practically allow decent shorting entries for bears to thrive in the long run, given that the crypto economy is in gains, holding above $0.001.
The price range between $0.001 and $0.0008 serves as a critical support zone where bears may intensify pressure in search of catalysts for potential recovery. However, maintaining long positions, regardless of entry levels, remains essential in anticipation of imminent rebound movements.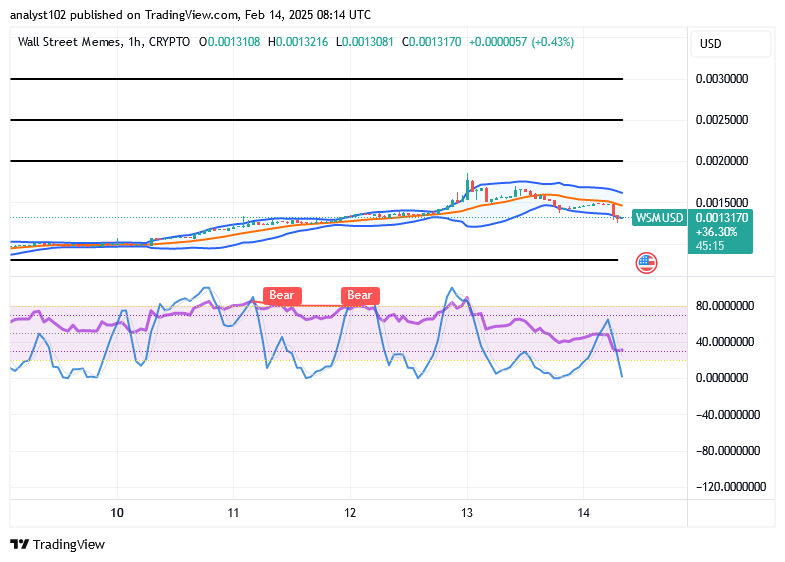
WSM/USD 1-hour chart
The 1-hour chart from the technical arrangement of the short-term setup reveals that the WSM/USD trade is in gains, holding above $0.001.
The stochastic oscillators, maintaining a bearish outlook, have turned sharply southbound into the oversold region, signaling a potential exhaustion of further declines in the base instrument. Concurrently, the Bollinger Bands’ trend lines are experiencing market interactions at the lower boundary, suggesting that buyers should prepare for an impending upswing.
AI will improve the world.
“Ai is going to make the world better” pic.twitter.com/QDMkudjcrl
— Wall Street Memes (@wallstmemes) February 11, 2025
Buy and stake WSM now!: Wall Street Meme (WSM)