Wall Street Memes (WSM) Price Resets, Settling New Rebound
Estimated Reading Time: 3 minutes
Don’t invest unless you’re prepared to lose all the money you invest. This is a high-risk investment and you are unlikely to be protected if something goes wrong. Take 2 minutes to learn more

Wall Street Memes Price Prediction – August 27
The prevailing, slightly stronger pullbacks in the buy–sell activity of the Wall Street Memes coin against the U.S. dollar have been observed in a deepening manner through the recent all-time low, as the base instrument resets on a baseline while establishing a fresh rebound.
As of today’s analysis time, the WSM/USD market’s movements have been such that the situation has been made for long-term position takers to be clearly alerted to take decent purchasing orders ahead of the presumed massive bullish bounce-off that will take place suddenly.
WSM/USD Market
Key Levels
Resistance levels: $0.0007, $0.0008, $0.0009
Support levels: $0.0005, $0.0004, $0.0003
WSM/USD – 4-hour Chart
The WSM/USD medium-term chart pictures it that the former instrument resets its basis, as the market is settling for a new rebound in its inputting style.
The Bollinger Bands are stretching at the lower side to the downside in a systemic pattern, warranting ideal long entries in the ongoing proceedings with increased volatility signs. The stochastic oscillators are now in the oversold region, clearly indicating the probability of the market gaining an upsurge in momentum in no time.
Will WSM/USD Medium-Term Chart Sustain Its Reset Basis as the Market Settles for Rebound?
The WSM/USD medium-term chart shows favorable reset strength, suggesting buyers may execute long position orders confidently, as the rebound momentum signals further upside potential.
Despite the apparent rebound attempt, the WSM/USD market still faces vulnerability, as repeated selling pressure around lower Bollinger zones highlights the risk of renewed declines. Traders should approach fresh long entries with caution until confirmation of a clear breakout emerges.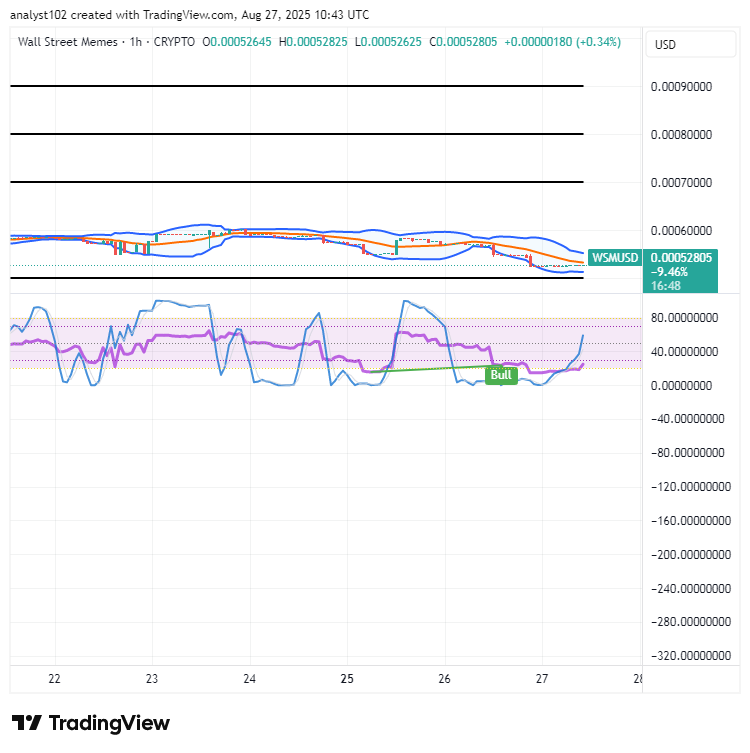
WSM/USD 1-hour chart
The 1-hour chart of the WSM/USD trade resets its footsteps, as the Wall Street Memes coin buyers are settling for a new rebound.
After buyers failed to firmly withstand minor declines, the market has seen a brief cluster of selling candles forming between the mid and lower Bollinger Bands. Meanwhile, stochastic oscillators are tactically turning north from deep oversold levels, signaling that long bids are gradually reclaiming ground.
Step into fresh trading opportunities using 1-25x powerful leverage. Now, both contracts are featured on Bybit Futures Grid Bot! Start your trading journey instantly.
BIGTIME: [https://i.bybit.com/20rabgrK](https://i.bybit.com/20rabgrK)
WSM: [https://i.bybit.com/ab1F9gWH](https://i.bybit.com/ab1F9gWH)
🚀 BIGTIMEUSDT & WSMUSDT Contracts now on Bybit!
— Bybit (@Bybit_Official) October 12, 2023
Dive into new trading opportunities with 1-25x leverage. Plus, they’re now on Bybit Futures Grid Bot! Start trading now.
📈 BIGTIME: https://t.co/FAQlbhnzAh
📈 WSM: https://t.co/pb2y2AfMBE#CryptoTrading #Bybit