Wall Street Memes (WSM) Trade Bounces, Boosting Hiking Moves
Estimated Reading Time: 4 minutes
Don’t invest unless you’re prepared to lose all the money you invest. This is a high-risk investment and you are unlikely to be protected if something goes wrong. Take 2 minutes to learn more
Wall Street Memes Price Prediction – April 28
Today’s bargaining operations have yet to have a different approach in the way that sideways have featured the pairing system of WSM/USD, given that the crypto-economic market now bounces on a notable baseline, boosting hiking moves.
Certain pricing dynamics are strategically evolving to consolidate stable gains, reinforcing indications of a bottoming structure while curbing the potential for extended bearish momentum within the confines of the Bollinger Bands’ trend envelopes. This controlled price behavior supports a medium- to long-term bullish bias, warranting sustained confidence among buyers in the eventual reestablishment of recovery trajectories.
WSM/USD Market
Key Levels
Resistance levels: $0.0015, $0.002, $0.0025
Support levels: $0.0007, $0.0006, $0.0005
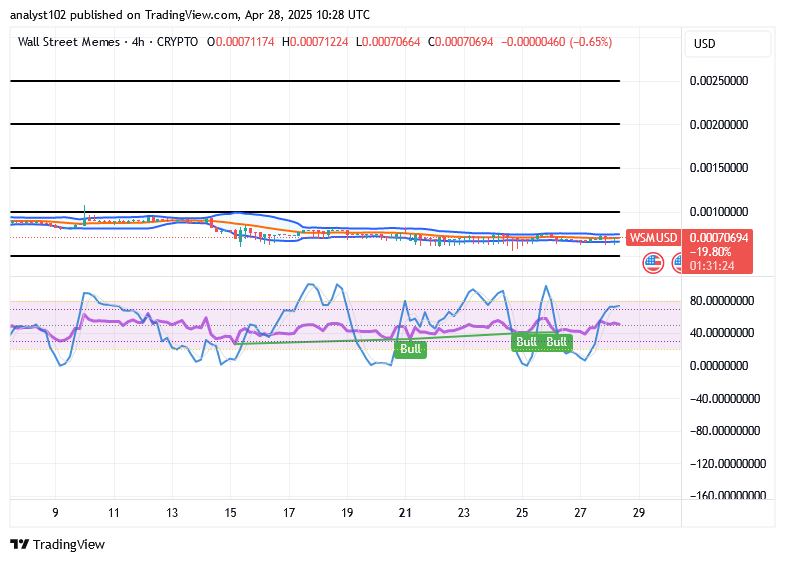
WSM/USD – 4-hour Chart
The medium-term chart of the WSM/USD market depicts that the crypto-economic market now bounces on a notable baseline, boosting hiking moves.
The Bollinger Bands are exhibiting an eastward elongation of their trend lines, maintaining compression with lower boundaries hovering just beneath the $0.001 trading zone, subtly reinforcing a consolidative structure. Concurrently, the stochastic oscillators have staged cyclical movements within a bullish signal configuration, suggesting underlying momentum is gradually building toward a potential breakout.
Is there evidence suggesting that WSM/USD market bulls might continue retreating toward the key support level of $0.0005 in the short term?
Over a couple of sessions, it has been demonstrated that most moves to the downside below the line of $0.001 are potentially going to create formidable buy entries, as the WSM/USD market now bounces on a notable baseline, boosting hiking moves.
Long-term investors must consistently reinforce their portfolio positions, given the recurrent yet shallow interactions with the lower Bollinger Band—an area that has historically preceded structurally stable rebound phases over extended horizons. Interpreting this sentiment further, the trajectory of recovery should persist uninterrupted, even amid transient signs of downward momentum; as such fluctuations are often symptomatic of broader accumulation rather than a definitive bearish reversal.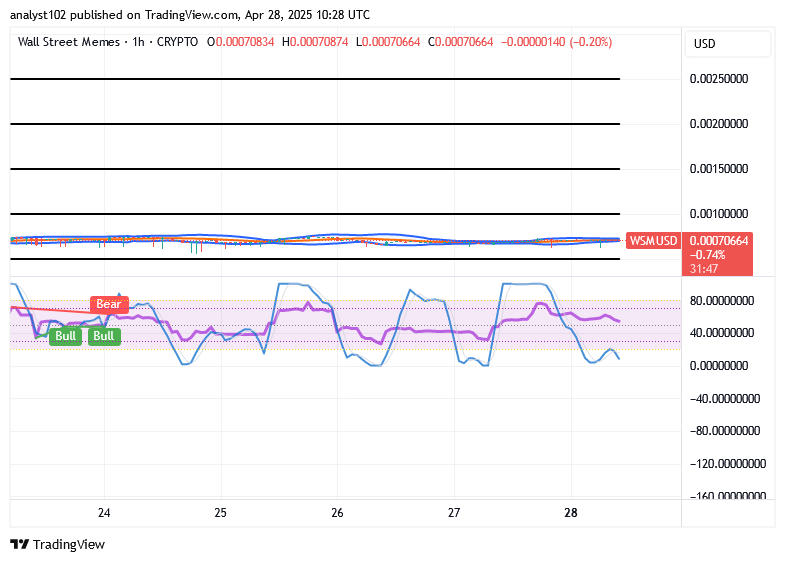
WSM/USD 1-hour chart
The technical outputs of the WSM/USD market based on hourly perspectives show that the market now bounces on a notable baseline, boosting hiking moves.
The stochastic oscillators are oscillating within the oversold region, signaling that bearish momentum is likely approaching exhaustion. Price actions forming candlesticks remain relatively weak, resulting in lower lows and lower highs near the Bollinger Bands, which continue to tighten under persistent downward pressure—shaped by successive lower lows and lower highs—thereby establishing a conducive setup for potential value-based buybacks at more appealing, discounted entry levels.
Stake Now for Rewards ➡️ https://wallstmemes.com/en/dashboard Buy Now for Value ➡️ https://wallstmemes.com
🔥 Up To 43% APY Now Available 🔥
— Wall Street Memes (@wallstmemes) October 8, 2023
(at the time of posting)
Stake Now ➡️ https://t.co/X031FQo0bW Buy Now ➡️ https://t.co/6zkwWf1VRF pic.twitter.com/o9qrY1zJn8