Wall Street Memes (WSM) Trade Finds Level, Buyers Stay Steady
Estimated Reading Time: 3 minutes
Don’t invest unless you’re prepared to lose all the money you invest. This is a high-risk investment and you are unlikely to be protected if something goes wrong. Take 2 minutes to learn more

Wall Street Memes Price Prediction – September 7
At the time of this analysis, the valuation of Wall Street Memes (WSM) coin against the purchasing strength of the U.S. dollar has fluctuated between $0.0005 and $0.0004, thereby positioning the broader market economy at a steady level as buyers maintain resilience.
The WSM/USD trade investors are encouraged to adopt a long-term perspective, as stability within the current valuation range signals strengthening market foundations. Sustained patience and gradual accumulation strategies may yield substantial benefits as the Wall Street Memes coin matures alongside broader economic growth.
WSM/USD Market
Key Levels
Resistance levels: $0.0007, $0.0008, $0.0009
Support levels: $0.0004, $0.0003, $0.0002
WSM/USD – 4-hour Chart
The WSM/USD medium-term chart showcases that the crypto-economic trade finds a level below $0.0005, as buyers stay steady.
The Bollinger Bands are currently positioned northward, maintaining the posture of the flagship pattern and signaling strengthening volatility alignment that supports consistent bullish advances within the prevailing upward market trend. The stochastic oscillators are also trending northbound in a steady movement, suggesting reinforced buying momentum that could sustain investor confidence across upcoming sessions.
Can the Crypto-Economic Trade Sustain Consolidation Below the $0.0005 Level as Buyers Remain Steady?
The WSM/USD trade sustaining below $0.0005 reflects consolidation, yet steady buyers reinforce stability, suggesting potential accumulation phases that may precede stronger upward retracement movements.
Market dynamics beneath the $0.0005 threshold highlight resilience, as steady buyers strengthen the underlying foundation. Such persistence indicates accumulating confidence, empowering bulls with renewed momentum and fostering optimism that the crypto-economic trade could transition into a broader upward trajectory supported by sustained accumulation.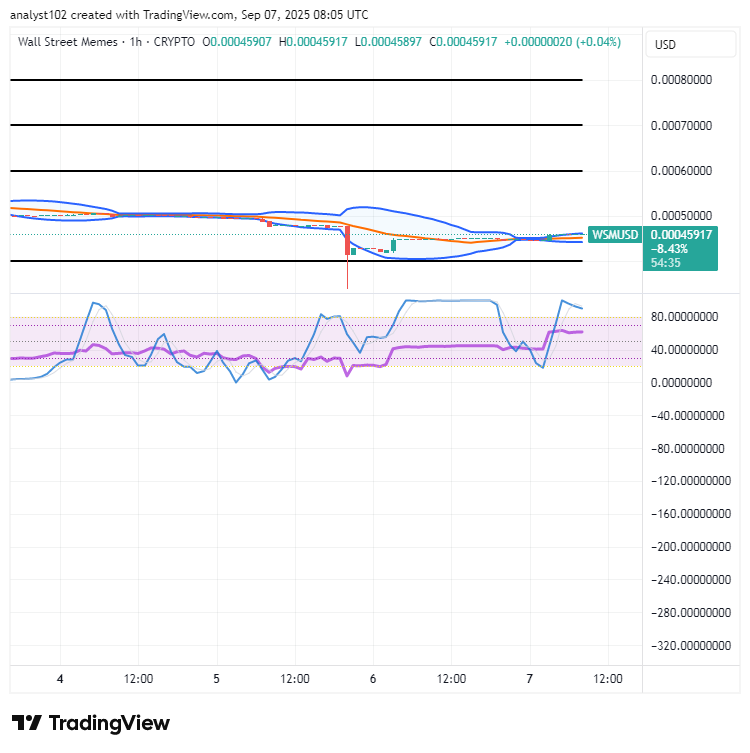
WSM/USD 1-hour chart
The 1-hour chart of the WSM/USD trade showcases that the crypto-economic market finds a level, given that buyers stay steady.
The Bollinger Bands have systematically repositioned to demonstrate that bulls are regaining strength by forming a formidable threshold, thereby reinforcing market sentiment and providing greater assurance of sustained upward price movement in the near term. The stochastic oscillators have advanced northbound into the overbought region, clearly indicating intensified buying pressure that reflects heightened optimism and underscores the potential for an extended bullish continuation beyond current resistance levels.
Explore exciting new trading opportunities with 1-25x leverage. Plus, they’re now officially available on Bybit Futures Grid Bot! Start trading right away today.
BIGTIME: [https://i.bybit.com/20rabgrK](https://i.bybit.com/20rabgrK)
WSM: [https://i.bybit.com/ab1F9gWH](https://i.bybit.com/ab1F9gWH)
🚀 BIGTIMEUSDT & WSMUSDT Contracts now on Bybit!
— Bybit (@Bybit_Official) October 12, 2023
Dive into new trading opportunities with 1-25x leverage. Plus, they’re now on Bybit Futures Grid Bot! Start trading now.
📈 BIGTIME: https://t.co/FAQlbhnzAh
📈 WSM: https://t.co/pb2y2AfMBE#CryptoTrading #Bybit