Polkadot (DOT) Slumps as Bulls Fail to sustain above $42 0verhead Resistance
Estimated Reading Time: 2 minutes
Don’t invest unless you’re prepared to lose all the money you invest. This is a high-risk investment and you are unlikely to be protected if something goes wrong. Take 2 minutes to learn more
Polkadot (DOT) Long-Term Analysis: Bullish
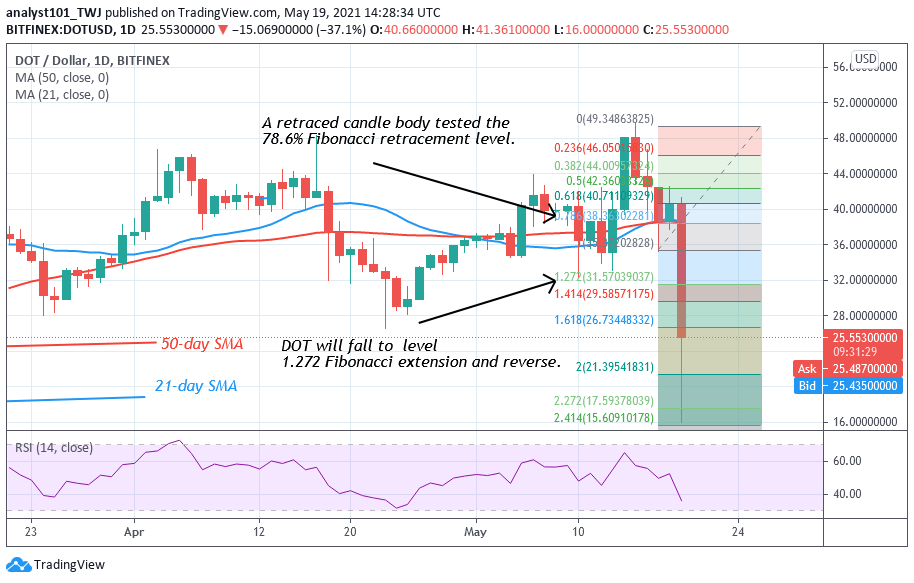
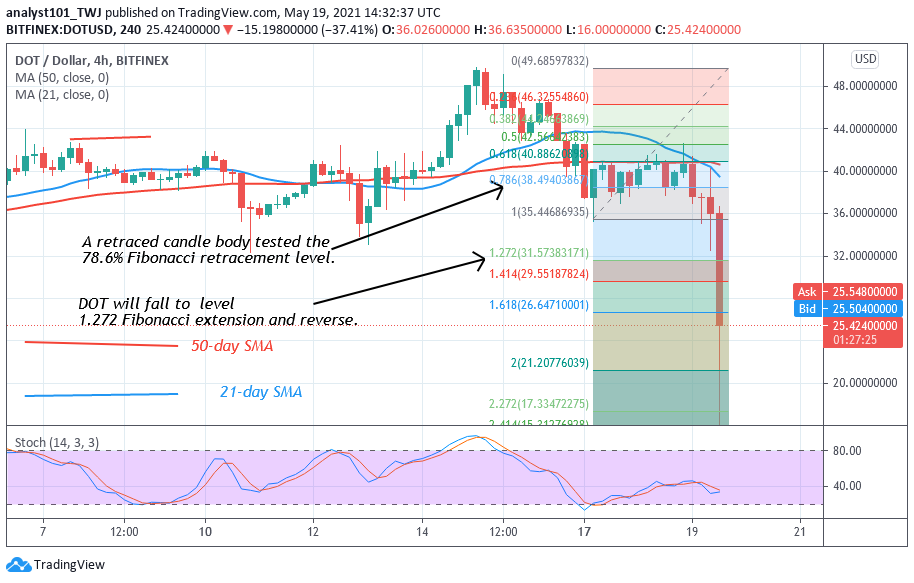
Today, DOT price plunged to the low of $16 and pulled back. The altcoin price has corrected upward to the high of $25. For the crypto’s price to recover, the bulls must push the altcoin above $40 high. Nevertheless, in the previous price action, Polkadot has been in a sideways move since February. The altcoin has been fluctuating between $28 and $42. Buyers have not been able to sustain the bullish momentum above the $42 resistance. Nonetheless, in today’s price action. The bulls broke the overhead resistance but the selling pressure above the resistance pushed DOT price to the range-bound zone. DOT price is falling. Meanwhile, on May 17 downtrend; a retraced candle body tested the 78.6% Fibonacci retracement level. This indicates that DOT price will decline to level 1.272 Fibonacci extension or the low of $31.57. DOT price has fallen beyond the Fibonacci extension. However, the market is expected to reverse.
Polkadot (DOT) Indicator Analysis
DOT price has fallen to level 35 of the Relative Strength Index period 14. It indicates that the market is in the downtrend zone and approaching the oversold region. The 21-day and 50-day SMAs are sloping horizontally.
Technical indicators:
Major Resistance Levels – $48, $52, $56
Major Support Levels – $32, $28, $24
What Is the Next Direction for Polkadot (DOT)?
On the 4 hour chart, DOT price is in a downward move. The coin fell from the high of $48 to $36 low. After three days of consolidation above $36 support, the bears resumed the downward move. On May 17 downtrend; a retraced candle body tested the 78.6% Fibonacci retracement level. The retracement indicates that DOT price will fall to level 1.272 Fibonacci extension or the low of $31.57.
Note: cryptosignals.org is not a financial advisor. Do your research before investing your funds in any financial asset or presented product or event. We are not responsible for your investing results