Wall Street Memes (WSM) Trade Lowers, Setting for Upswings
Estimated Reading Time: 3 minutes
Don’t invest unless you’re prepared to lose all the money you invest. This is a high-risk investment and you are unlikely to be protected if something goes wrong. Take 2 minutes to learn more
Wall Street Memes Price Prediction – February 15
As there have been impending signal notes toward seeing the WSM/USD market bears holding firmly at a close buy signal side of the lower Bollinger Band, buyers would have continued to fasten their belts against suffering unnecessary losses, given that the crypto-economic trade now lowers, setting for upswings above $0.001.
The current positioning of the oscillators suggests that further stable declines are unlikely, even if the market struggles to break higher from the levels indicated by the Bollinger Bands. In light of this, long-term holders should maintain their positions and stick to their long-holding strategies.
WSM/USD Market
Key Levels
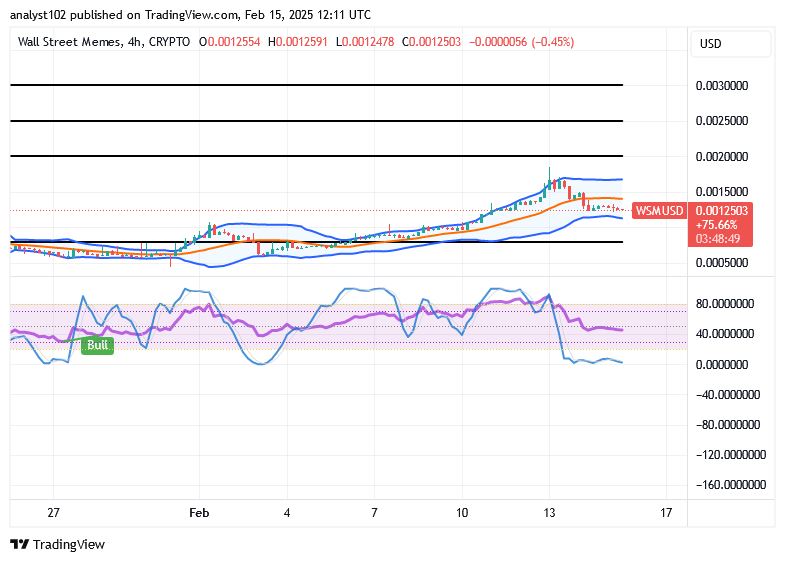
Resistance levels: $0.002, $0.0025, $0.003
Support levels: $0.0008, $0.0006, $0.0004
WSM/USD – 4-hour Chart
The WSM/USD market 4-hour chart shows that the crypto-economic market currently lowers, setting for upswings above $0.001.
The current candlestick pattern on a medium-term basis shows that both buyers and sellers are less active near the lower Bollinger Band. The stochastic oscillators are in the oversold region, moving weakly, indicating a lack of selling pressure at this point in time.
Are there strong indications that the WSM/USD market will lose base more against the lower Bollinger Band’s trend line in the near time?
There have been no firm signs emanating from technical indicators that the WSM/USD trade will suffer sustainable losses alongside the lower Bollinger Band if it tends to stretch back southward from its present positioning stance, as the price lowers, setting up for upswings in inputs.
This situation suggests missing the opportunity to accumulate at lower valuations in the current cycle, ahead of the anticipated aggressive upward momentum. If traders enter during subsequent rallies, it may result in a fear-driven mindset, leading to potentially unfavorable long-term positions.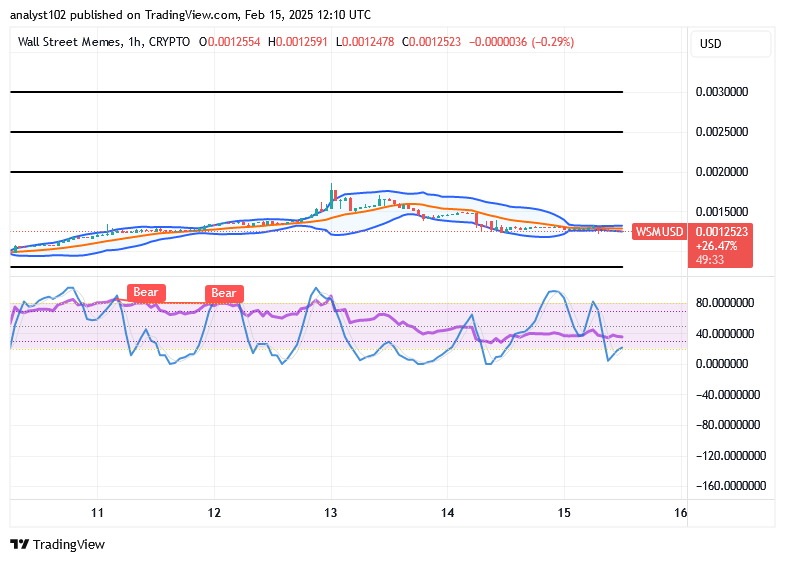
WSM/USD 1-hour chart
The 1-hour chart from the technical outlook of the short-term setup showcases that the WSM/USD market presently lowers, setting up for upswings.
The Bollinger Bands’ trend lines have shifted notably northward, positioning just above $0.001. Meanwhile, the stochastic oscillators have dipped southward, entering the oversold region. This movement suggests an optimal opportunity to enter new positions and potentially expand investment portfolios.
I can become a millionaire by just doubling my money twelve times.
I only need to double my money 12 times and I can be a millionaire pic.twitter.com/6sCNzTNBPK
— Wall Street Memes (@wallstmemes) February 15, 2025
Buy and stake WSM now!: Wall Street Meme (WSM)