Wall Street Memes (WSM) Trade Stays On, Progressing Bounces
Estimated Reading Time: 4 minutes
Don’t invest unless you’re prepared to lose all the money you invest. This is a high-risk investment and you are unlikely to be protected if something goes wrong. Take 2 minutes to learn more

Wall Street Memes Price Prediction – July 27
It is gradually being that increasing efforts have been continually reproducing in the way that bulls have been acting against the valuation of the American currency, just as the crypto-economic market now stays positive, progressing bounces in the mode of operations.
The repositioning posture of the Bollinger Bands’ trend lines is now slightly angled with a systemic and algorithmic insight, depicting potentially ideal recouping entry points around the volatility indicators of the WSM/USD markets. In line with that structural format, strategic buying efforts should be executed cautiously, as the oscillating tools currently signify that market forces remain in a compressed and weakened lower form.
WSM/USD Market
Key Levels
Resistance levels: $0.0009, $0.001, $0.0011
Support levels: $0.0006, $0.0005, $0.0004
WSM/USD – 4-hour Chart
As of the time of this piece, the medium-term chart of the WSM/USD trade showcases that the crypto price presently stays on, progressing bounces in its inputs.
The stochastic oscillators are swerving decisively southbound, deepening their trajectory into the oversold region, suggesting that further aggressive motions fearfully to the downside from the present trade zones of $0.0007 appear technically unrealistic in the near future. The Bollinger Bands, particularly between the middle and lower bands, are increasingly being used as strong instruments toward establishing a technically sound base entry to secure long-hold strategic orders.
Should WSM/USD Investors Initiate Sell Positions Upon Abrupt Breakdown Below the Lower Bollinger Band?
An abrupt breakdown below the lower Bollinger Band often represents oversold conditions rather than a sustainable bearish continuation, as such movements typically trigger short-lived volatility instead of a valid trend shift—warranting caution against emotionally driven downside participation and favoring tactical patience for confirmation from oscillators or reversal candlestick patterns, given that the WSM?USD market stays on, progressing bounces around the indicator.
Given the prevailing structure showcasing the paired instruments’ extended bullish trajectory, long-term position takers are strategically advised to concentrate their accumulation efforts within the zones demarcated by the middle and lower Bollinger Bands. This region serves as a technically favorable accumulation corridor, where adherence to disciplined buying thoughts is warranted—pending a confirmed upsurge pattern, sustained directional continuity, or an impending volatility expansion to validate further northbound positioning.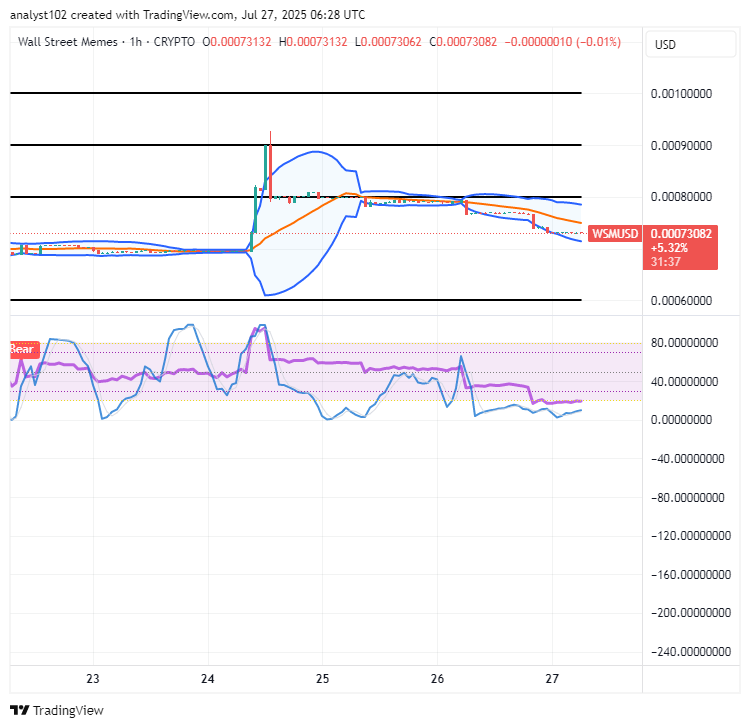
WSM/USD 1-hour chart
The 1-hour chart of the WSM/USD trade is showcasing that the short-term running style of the crypto trade presently stays on, progressing bounces.
The stochastic oscillators have turned decisively, swinging southbound and progressively deepening their movement into the oversold region, signaling potential exhaustion of downward momentum. In the meantime, the Bollinger Bands indicators are technically aligned to highlight the $0.0008–$0.0007 range as a critical demand zone, where buyers are expected to consider executing strategic long positions amid emerging accumulation signals.
$WSM community, we saw your enthusiastic Tweets!
$WSM / $USDT is now officially tradeable on #Bybit Perpetuals.
Trade here: https://i.bybit.com/1Wab4K3z
$WSM community, we saw your Tweets! 👏$WSM / $USDT is now tradeable on #Bybit Perpetuals.
— Bybit (@Bybit_Official) October 13, 2023
Trade here: https://t.co/le4XyVyXaZ
Also want your project listed? Share your suggestions here:https://t.co/W7EWJVVNV5 https://t.co/XgXoL7g0rF
Buy and stake WSM now! https://wallstmemes.com/