Wall Street Memes (WSM/USD) Trade Is Firmly, Adding Energy
Estimated Reading Time: 3 minutes
Don’t invest unless you’re prepared to lose all the money you invest. This is a high-risk investment and you are unlikely to be protected if something goes wrong. Take 2 minutes to learn more

Wall Street Memes Price Prediction – January 23
It is closely observed that the purchasing spree is systemically fine-tuning its basis at lower ends of the indicators, as today’s financial trade outlook shows that the WSM/USD trade is firmly, adding energy.
The position of the oscillating tools at the time of writing indicates that the bulls in the WSM/USD market are taking their time in their attempts to make a return. The bottom horizontal line at $0.0006 has been shown to be stable enough to withstand potential downward moves for a considerable amount of time.
WSM/USD Market
Key Levels
Resistance levels: $0.0012, $0.0017, $0.0022
Support levels: $0.0007, $0.0005, $0.0003
WSM/USD – 4-hour Chart
The WSM/USD market 4-hour chart showcases that the crypto-economic market is firmly adding energy.
With a signal note of a variety of genres, the stochastic oscillators have begun to tentatively swing about the value of 20. In order to determine the region of likely factors to support historically strong rebounding quickly, the trend lines of the Bollinger Bands are now being observed attempting to be repositioned at lower zones.
Without more drops below $0.00078905, could the WSM/USD market continue to hold around the $0.0006 mark?
There might be a line of more decreases in the valuation of the WSM/USD market as it is trading around $0.00070905 to secure a sudden bounce-off, given that the crypto-economic trade is firm, adding energy at the time of this analysis.
Because varied 4-hour candlestick sizes indicate a sideways trend, purchasers needed to have optimism that they would see a perfect comeback quickly, which would then lead to a path back to the moon side of the paired instrument in the long-term running mode. The most important rule to follow when it comes to the trade method is patience.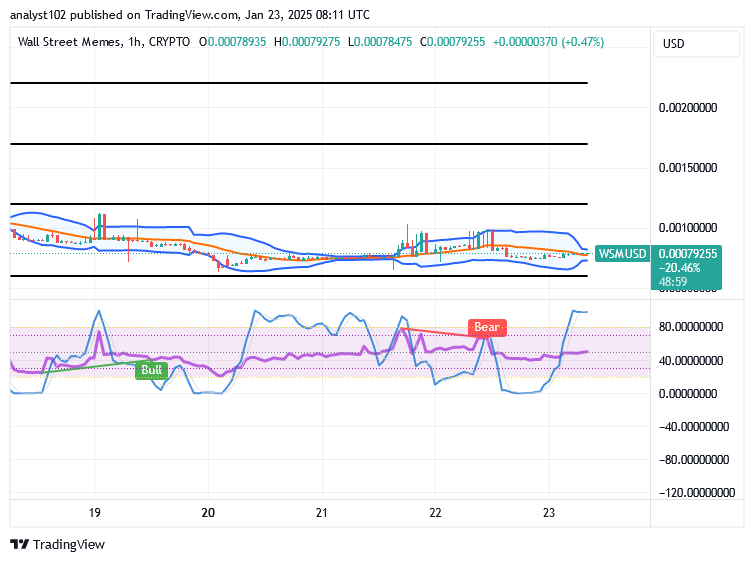
WSM/USD 1-hour chart
The 1-hour trade chart of the WSM/USD showcases the pairing instrument is firmly, adding energy.
At the time this article was written, there was a brief signal warning remark from the stochastic oscillators’ standpoint indicating that purchasers needed to take precautions before placing new purchasing orders. To highlight the reduced locations, the Bollinger Bands indicators are positioned closely to the downward, which is great for placing respectable longing orders.
Center, left, and right tin foil hats.
Tin foil hats left, right and centre https://t.co/d1pHixM5ra
— Wall Street Memes (@wallstmemes) January 23, 2025
Buy and stake WSM now!: Wall Street Meme (WSM)