Wall Street Memes (WSM/USD) Trade Logs Up, Reflects Strength
Estimated Reading Time: 3 minutes
Don’t invest unless you’re prepared to lose all the money you invest. This is a high-risk investment and you are unlikely to be protected if something goes wrong. Take 2 minutes to learn more
Wall Street Memes Price Prediction – July 11
Most of the price action signals observed between bulls and bears in the trading activity pairing the Wall Street Memes coin with the U.S. dollar have consistently exhibited varying degrees of momentum as the price logs upside—reflecting underlying strength that could serve as a solid foundation for long-term positioning.
As the WSM/USD trade condition is currently revealing it, it is shaping into a scenario of being tactically positioned through multi-layered technical perspectives—incorporating momentum dynamics, volatility structure, and pattern recognition—to enable buyers to secure more stable and well-timed long entries in the ongoing market proceedings. The lower Bollinger Band continues to act as a key dynamic support level, playing an instrumental role in nullifying most downside retracement attempts and reinforcing bullish continuation prospects.
WSM/USD Market
Key Levels
Resistance levels: $0.0007, $0.0008, $0.0009
Support levels: $0.0005, $0.0004, $0.0003
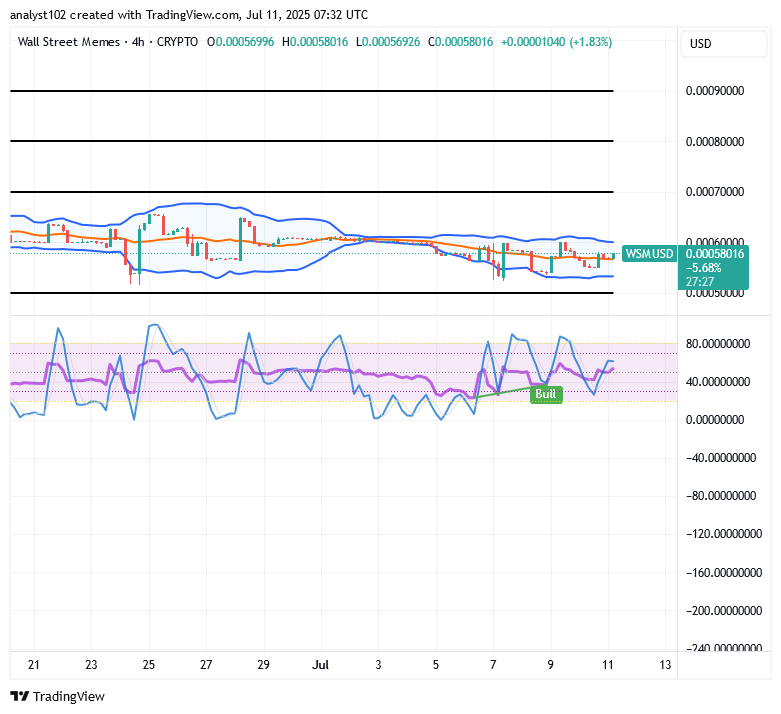
WSM/USD – 4-Hour Chart
The WSM/USD 4-hour chart showcases that the crypto-economic market logs upside and reflects strength in its moving mood.
The stochastic indicators remain in a gradual, curving alignment, suggesting the market is positioning for a structural recovery and sustainable upward correction. Concurrently, the Bollinger Bands continue to widen moderately, accompanied by a series of diverse candlestick patterns consolidating within a horizontal channel along the prevailing trend boundaries.
Is It Strategic for Long-Term WSM/USD Participants to Sustain Optimism Amid Pre-Rebound Market Conditions?
Long-term WSM/USD market partakers may not be too wary of joining the moves at will because the valuation of the base instrument is still undervalued, given that the price logs upside, reflecting strength at the trade zones.
WSM/USD is exhibiting signs of latent accumulation, with bearish momentum slowing and technicals hinting at a potential shift. Sudden sell-offs at current levels may prove premature, as price structure begins to favor bullish recovery. Traders should tread carefully, as the groundwork for a stronger rebound appears to be forming.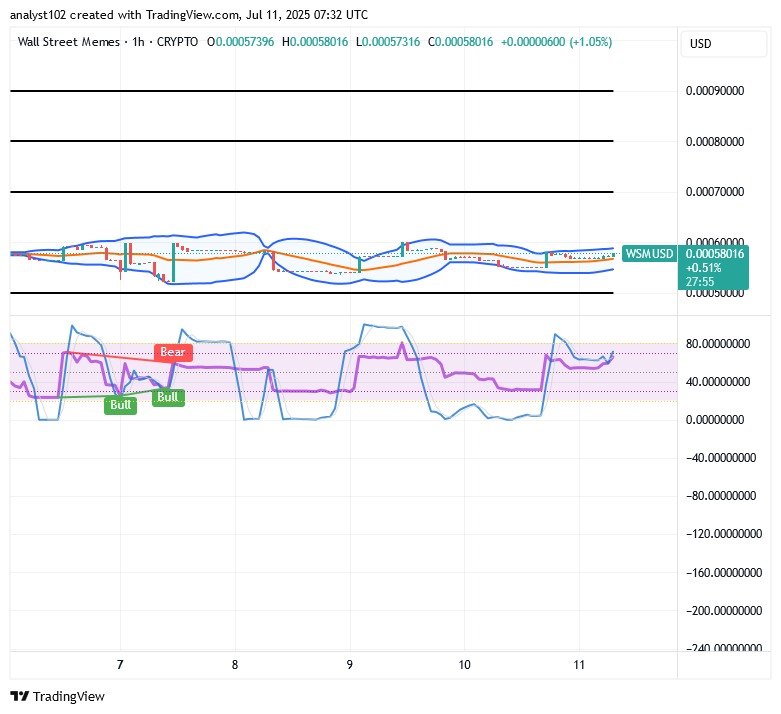
WSM/USD 1-Hour Chart
The 1-hour chart, as of the time of today’s technical piece, demonstrates that the WSM/USD logs upside, reflecting strength in the proceedings.
The Bollinger Bands are undergoing a steady expansion cycle, reflecting increasing volatility and highlighting emerging high-probability zones for calculated long entries. Meanwhile, the stochastic oscillators are currently veering upward near the 80 level, suggesting that bullish momentum is consolidating in anticipation of possible abrupt upward price reactions.
\$WSM / \$USDT is now tradeable on #Bybit Perpetuals with enhanced liquidity and precision.
$WSM community, we saw your Tweets! 👏$WSM / $USDT is now tradeable on #Bybit Perpetuals.
— Bybit (@Bybit_Official) October 13, 2023
Trade here: https://t.co/le4XyVyXaZ
Also want your project listed? Share your suggestions here:https://t.co/W7EWJVVNV5 https://t.co/XgXoL7g0rF