Wall Street Memes (WSM/USD) Trade Resets Basis, Tending Hikes
Estimated Reading Time: 3 minutes
Don’t invest unless you’re prepared to lose all the money you invest. This is a high-risk investment and you are unlikely to be protected if something goes wrong. Take 2 minutes to learn more

Wall Street Memes Price Prediction – May 23
Indecision appears to be prevailing in the WSM/USD market, characterized by the fluctuating presence of bears and bulls, as the crypto-economic trade resets its basis below $0.001 and trends upward.
The lower band of the Bollinger Bands indicator currently aligns with a systemic framework that has historically facilitated sustained momentum accumulation. However, the emergence of a potential comeback has prompted long-term position holders to preemptively capture incremental gains while the prevailing trade thesis holds. This strategy, though opportunistic, is now coupled with early signals of market indecision, warranting increased caution as volatility compresses near critical support levels.
WSM/USD Market
Key Levels
Resistance levels: $0.0015, $0.002, $0.0025
Support levels: $0.0005, $0.0004, $0.0003
WSM/USD – 4-hour Chart
The medium-term chart (4-hour chart) of the WSM/USD trade resets its basis above $0.0005, tending hikes.
The stochastic oscillators initially traversed southbound before attempting a corrective northbound swerve, indicating the potential emergence of latent buying forces. Concurrently, the configurationally alignment of the Bollinger Bands’ trend lines suggests a deliberate repositioning posture, evolving into a developing bull flag formation despite the persistence of subdued and inconsistent price action dynamics.
Are signs of continued WSM/USD consolidation emerging, cautioning sellers as oversold conditions near?
The consolidation movement pattern of the WSM/USD market seem not to provide for brighter bearish signal notes , given that the crypto-economic trade presently resets its basis, tending hikes.
Price action hovering near the lower Bollinger Band, alongside supportive indicators, hints at a potential bullish reversal. The setup favors long positions, with traders anticipating a corrective rebound. Positive momentum could build quickly if confirmation signals emerge.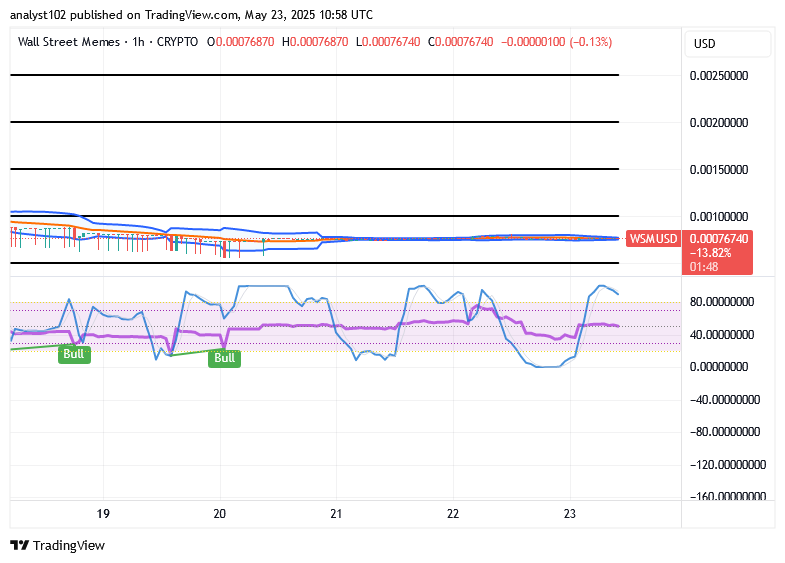
WSM/USD 1-hour chart
The 1-hour chart from the technical picture of the short-term setup reveals that the crypto-economic market resets its basis, tending to hikes in its inputs.
The stochastic oscillators are currently positioned in the overbought zone, indicating that short-term momentum traders should exercise caution when considering new long entries. Meanwhile, the Bollinger Bands are exhibiting horizontal convergence between the $0.001 and $0.0005 range, suggesting a state of market equilibrium with balanced pressure from both buyers and sellers.
The $WSM community engagement spike was noted—we observed and analyzed your Tweets promptly!
$WSM community, we saw your Tweets! 👏$WSM / $USDT is now tradeable on #Bybit Perpetuals.
— Bybit (@Bybit_Official) October 13, 2023
Trade here: https://t.co/le4XyVyXaZ
Also want your project listed? Share your suggestions here:https://t.co/W7EWJVVNV5 https://t.co/XgXoL7g0rF