$SPONGE (SPONGE/USD): Poised for a Bullish Breakout
Estimated Reading Time: 3 minutes
Don’t invest unless you’re prepared to lose all the money you invest. This is a high-risk investment and you are unlikely to be protected if something goes wrong. Take 2 minutes to learn more

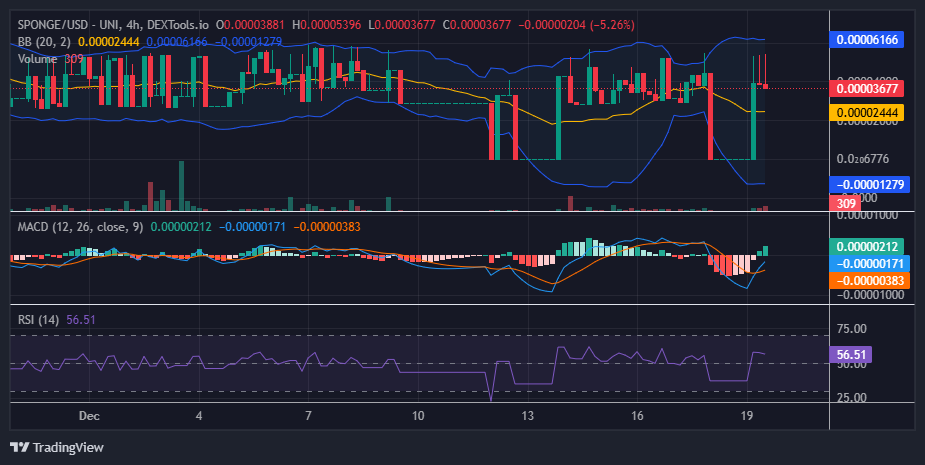
In our previous analysis of the SPONGE/USD market, we observed a sharp decline in price to $0.0000006. As anticipated, the market bounced back and is now stabilizing at $0.0000368, above the critical $0.00003 support level. The bulls are maintaining a firm position at this level, possibly setting the stage for a rally toward the key $0.00006 price level. Let’s delve deeper into the market analysis by examining the insights provided by key technical indicators.
Key Market Dynamics:
- Resistance Levels: $0.00005, $0.000055, $0.000060
- Support Levels: $0.000020, $0.0000195, $0.000019
$SPONGE Technical Outlook
In recent trading sessions, we observed increased downward volatility as the price of SPONGE/USD reached a new low. Despite this, bullish sentiment remains strong around the $0.00003 support level, extending its influence toward the $0.00006 resistance level. This dynamic has contributed to heightened market volatility.
However, the bulls continue to hold firm above the $0.00003 level. Notably, technical indicators suggest the possibility of a breakout, highlighted by a bullish divergence. Analyzing the chart reveals a divergence between price action and the Moving Average Convergence and Divergence (MACD) indicator: while the price declined from approximately $0.000054 to $0.000037, the MACD histogram within the same trading session trended upward.
This discrepancy may signal an impending bullish move in the crypto market, suggesting that traders should anticipate a potential bounce, with the price likely rallying back toward the $0.000054 level.
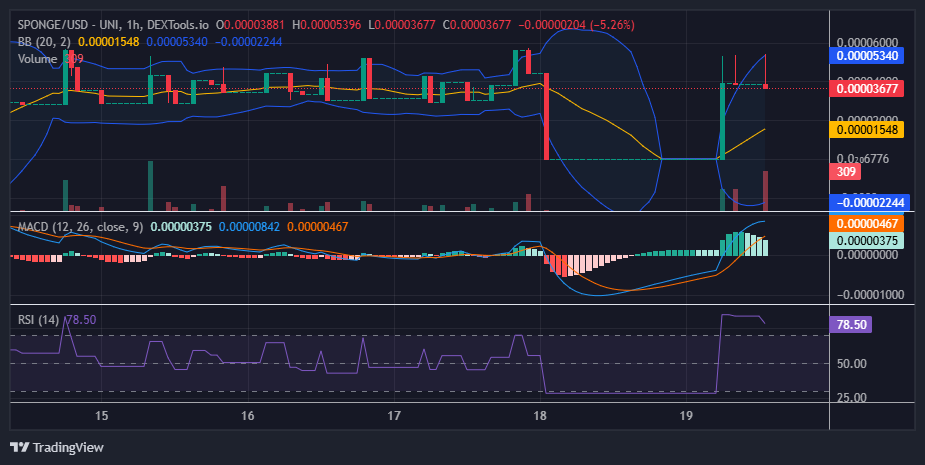
$SPONGE (SPONGE/USD) 1-Hour Chart Insights
In the recent trading session, a shooting star candlestick pattern has appeared on the chart. Typically, this signals a potential move for the market to trend lower. However, the tall histogram accompanying the pattern indicates significant bearish pressure. Despite this, the bulls have shown resilience in defending their position. As a result, the price may hold its ground and, instead of breaking lower, could potentially bounce higher.
Buy $SPONGE!
Finance bros 🤝 Crypto bros
what world are we living in? 💦💦 pic.twitter.com/8rqCnr3xkG
— $SPONGE (@spongeoneth) December 15, 2024
Join the SPONGE community and be part of the next big crypto sensation! Buy Sponge ($SPONGE) today!