Solana (SOL) Price Prediction: SOL Bullishness Thins
Estimated Reading Time: 3 minutes
Don’t invest unless you’re prepared to lose all the money you invest. This is a high-risk investment and you are unlikely to be protected if something goes wrong. Take 2 minutes to learn more
Solana (SOL) Price Prediction: May 17
The Solana market managed to gather moderate bullish momentum off the $140 mark in the previous session. Meanwhile, the market has lingered above this level for some time. However, the observed bullishness has considerably cooled as trading activities progress.
SOL/USDT Long-term Trend: Bullish (Daily Chart)
Key Levels
Resistance Levels: $165.00, $170.00, and $175.00
Support Levels: $160.00, $155.00, and $150.00
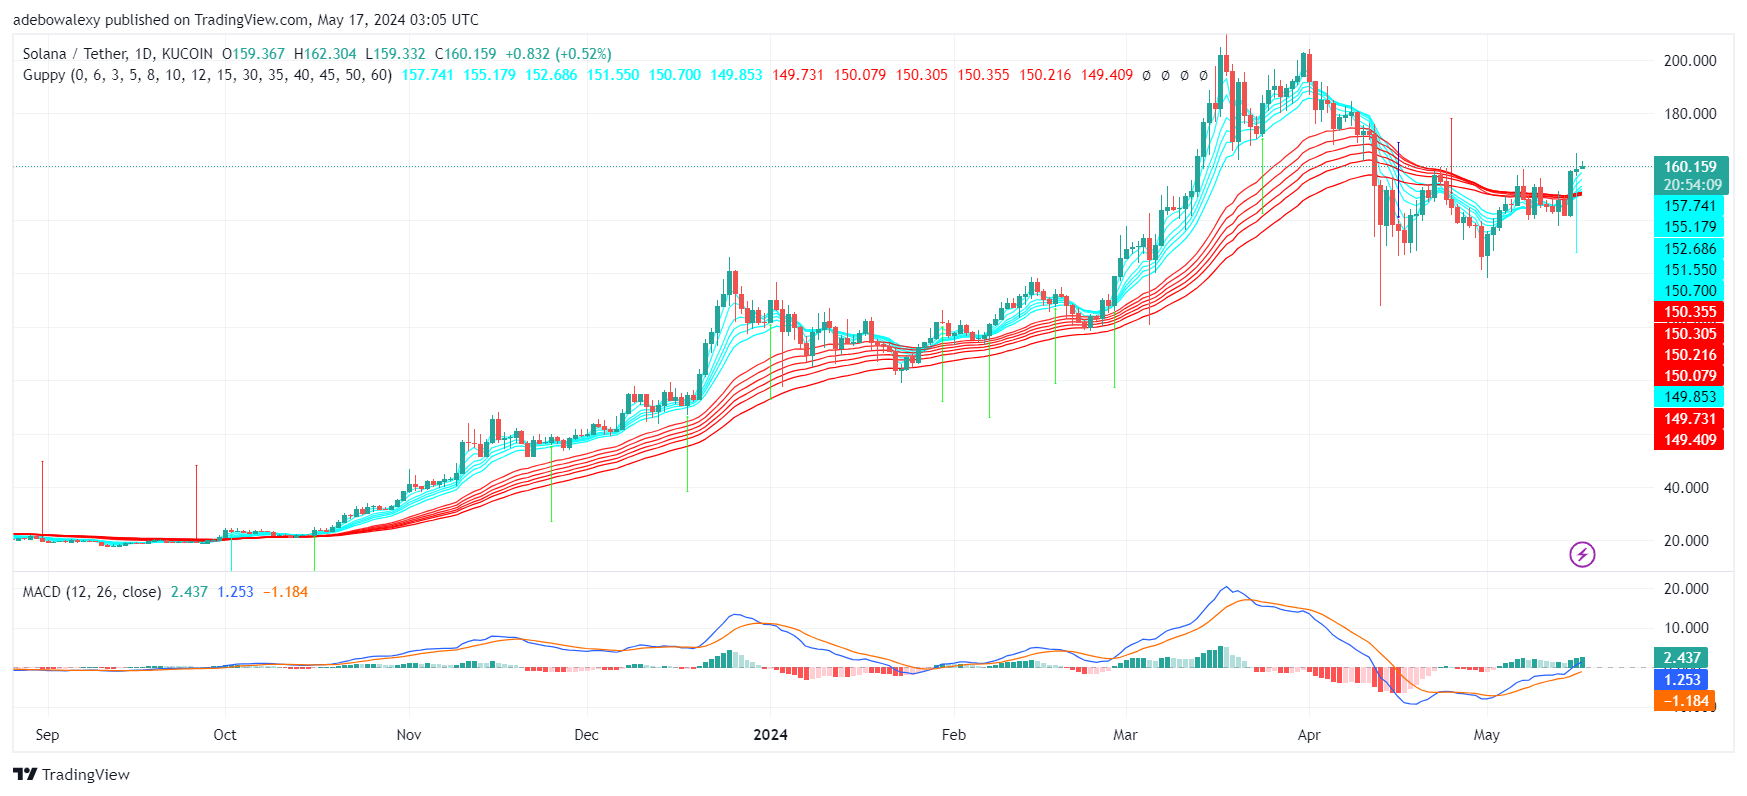
Daily Chart
On the daily price chart, trading activities have remained above the Guppy Multiple Moving Average (GMMA) curves. Trading activities have significantly reduced, as evidenced by the size of the last two price candles on this chart. Meanwhile, the Moving Average Convergence Divergence (MACD) continues to rise above the equilibrium level. Likewise, the bar of this indicator remains solid green above the equilibrium level, indicating that the upside focus stays intact.
Solana Price Prediction: What Might Happen Next in the Solana Market?
Approaching the SOL/USDT market from a broader perspective, the price trajectory is still holding up. However, a closer examination reveals that while the upside trajectory continues, the momentum is waning. The most recent price candles show a significant decline in momentum.
Nevertheless, the appearance of the price candle above the GMMA lines supports the view that the upside correction is ongoing. Additionally, the MACD bars remain solid green, suggesting that the market may still advance towards higher price levels around the $165 or $170 mark.
SOL/USDT Medium-term Trend: Solana Faces Strong Downward Forces (4H Chart)
The Solana 4-hour market has further revealed recent price activity. The price chart displays a sudden and quick downward correction in the past three to four sessions. However, bulls managed to halt the decline in the previous session, keeping the market above most of the GMMA indicator curves. Additionally, the MACD indicator lines are still above the equilibrium level. Despite the recorded downward correction, the bars of the indicator are now pale green and shorter.
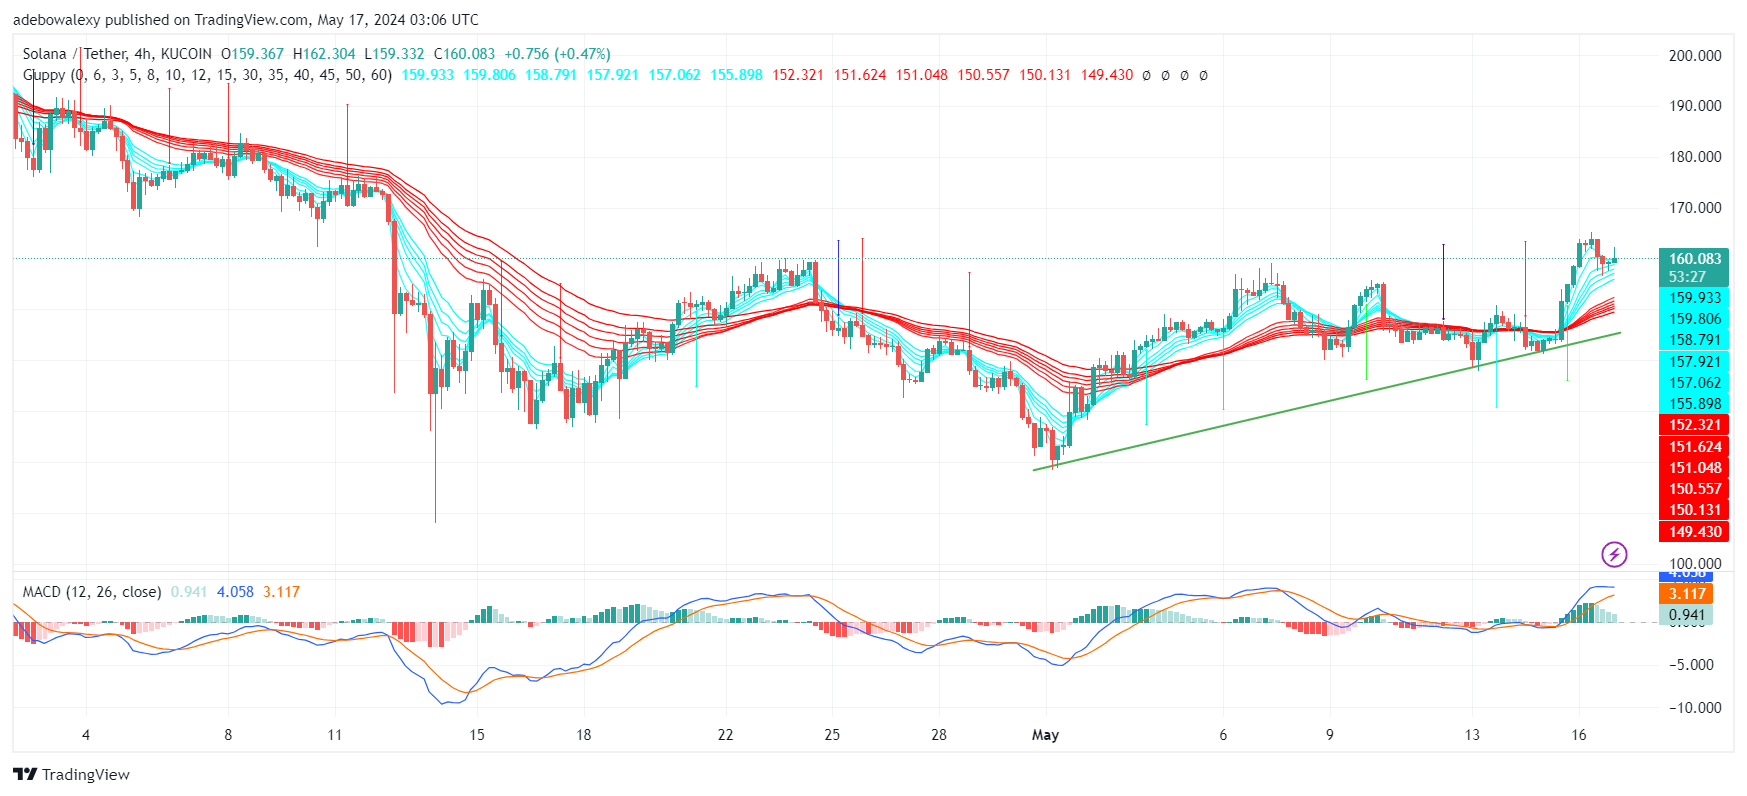
4-Hour Chart
Signs from the Solana 4-hour market indicate significant challenges. Nonetheless, it can be seen that upward forces are still active, despite facing considerable resistance. Given that upward forces are still resisting further downward corrections, traders might want to maintain their bullish expectations towards the $165.00 and $170.00 marks.