Bitcoin (BTC) Price Prediction: BTC/USDT Seems Trapped Between $95,000 and $92,200
Estimated Reading Time: 3 minutes
Don’t invest unless you’re prepared to lose all the money you invest. This is a high-risk investment and you are unlikely to be protected if something goes wrong. Take 2 minutes to learn more

Bitcoin (BTC) Price Prediction (January 1):
After the Bitcoin market reached its all-time high around the $109,000 price level, we can see that the market has been spiraling downwards. The market has been falling to lower lows. However, recent price movement suggests that price activity may have hit a strong baseline at the $92,200 price level.
BTC/USDT Long-Term Trend: Bearish (Daily Chart)
Key Price Levels:
Resistance: $95,000, $100,000, $104,000
Support: $90,000, $85,000, $80,000
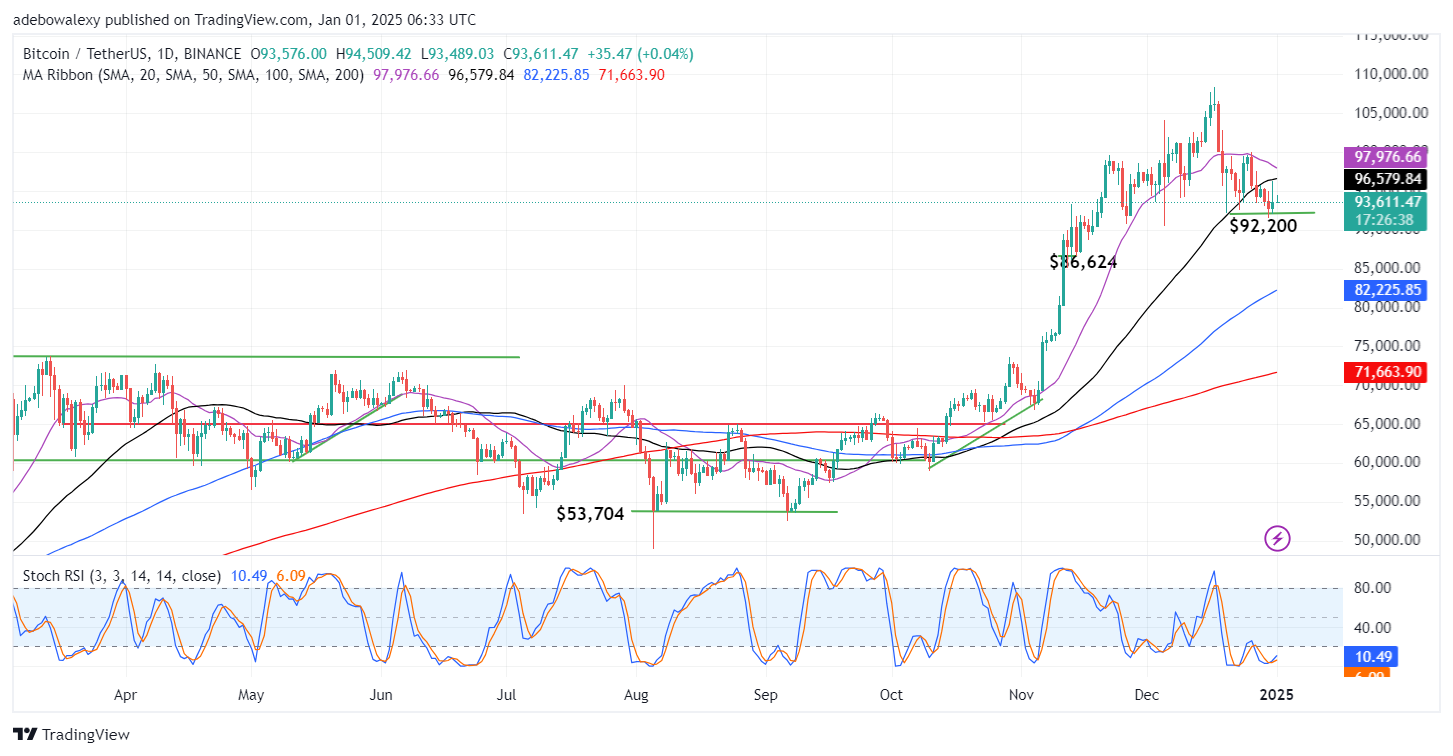
Price activity in the Bitcoin daily market has rebounded off the support level at the $92,200 price level. The corresponding price candle to the previous session has contracted downward but retains some of the recorded gains till the end. However, the ongoing session has appeared as a heavily compressed green price candle. Nevertheless, the Stochastic Relative Strength Index (RSI) continues to rise slightly upwards from the oversold region.
Bitcoin (BTC) Price Prediction: BTC/USDT Minimal Gains May Be Erased
The Bitcoin market has an upward trajectory, but a slight one, ever since its price action rebounded off the $92,200 price level. Also, the convergence of the 20- and 50-day Moving Average (MA) lines can be seen to be converging steadily above price action.
As a result, the last price candle appears heavily compressed. Be that as it may, the lines of the Stochastic RSI are rising upward from the depth of the oversold region. At this point, price movement still calls for more critical examinations, perhaps on a smaller price time frame for the purpose of spotting short-term opportunities.
Bitcoin (BTC) Price Prediction: BTC/USDT Downward Forces Seek Dominance (4-Hour Chart)
Coming to the Bitcoin 4-hour price chart, it is revealed that price action remains largely under the influence of downward forces. This opinion is derived from the fact that price action has fallen below all the MA lines. In addition, the last price candle has appeared bearish, although it continues to lurk around the 20-day MA curve.
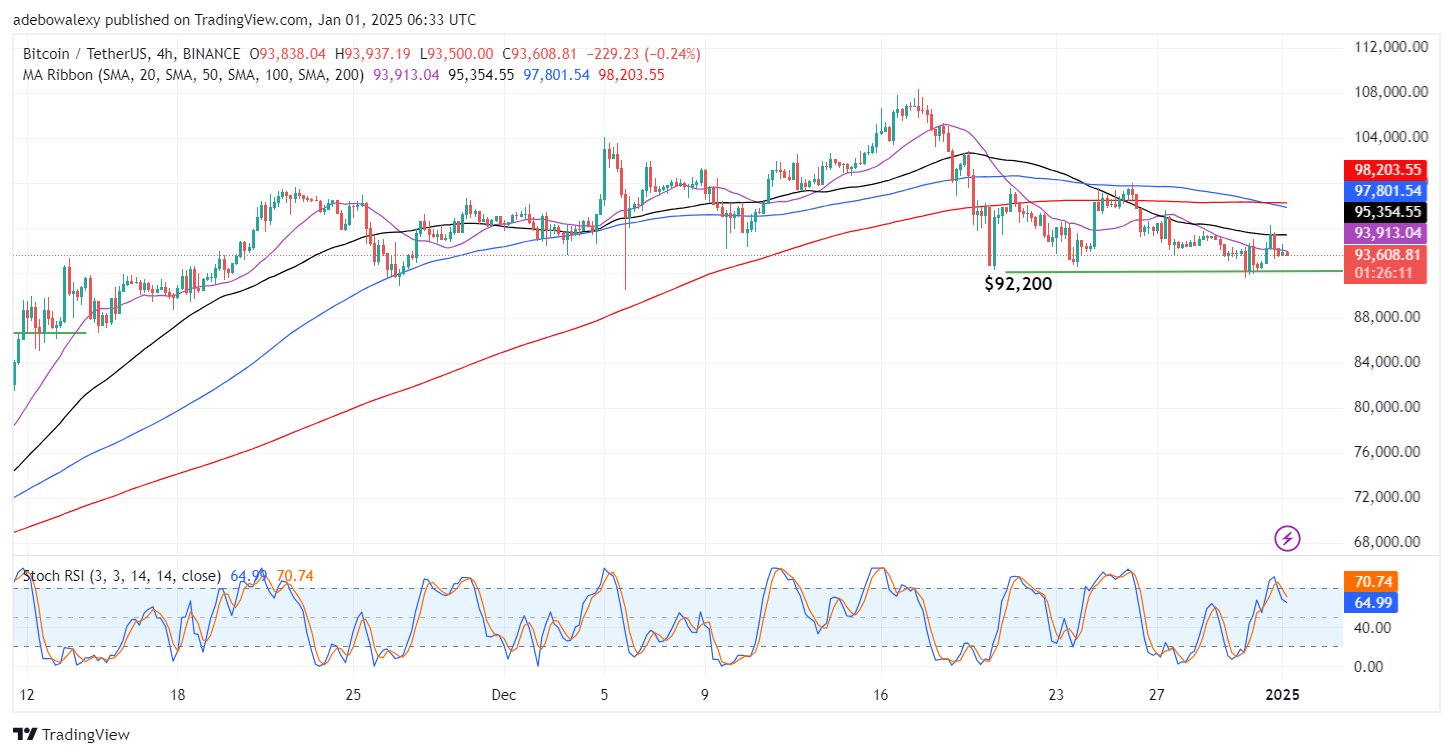
The Stochastic RSI lines also have a downward trajectory and have fallen through the 80 mark of the indicator. The lead line of the indicator seems a bit deflected towards a crossover, but there lies some distance between the two lines of the indicator. Therefore, market participants can assume that this market has a short-term bearish outlook towards the $92,000 support price level.