Bitcoin Price Prediction: BTC/USDT Flirts With the $73,000 Price Level
Estimated Reading Time: 3 minutes
Don’t invest unless you’re prepared to lose all the money you invest. This is a high-risk investment and you are unlikely to be protected if something goes wrong. Take 2 minutes to learn more

Bitcoin Price Prediction for October 30
Price activity in the BTC/USDT daily market broke above the $70,000 price level in the previous session. As a result, Bitcoin now trades at a significant distance above technical indicators, hinting that further increases may be forthcoming.
BTC/USDT Long-term Trend: Bullish (Daily Chart)
Key Price Levels:
Resistance: $75,000, $80,000, $85,000
Support: $66,500, $63,000, $60,000
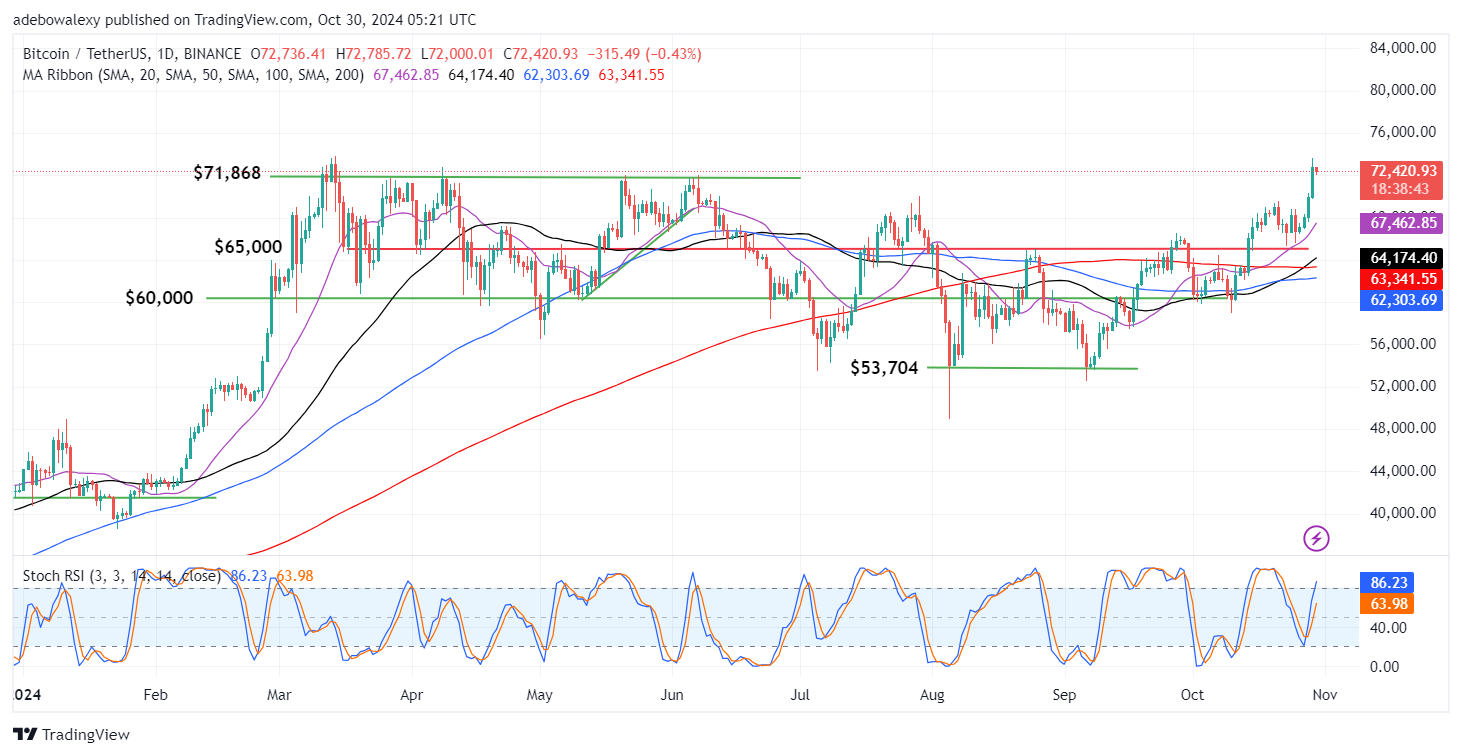
Although the Bitcoin daily market has seen a slight downward retracement in today’s trading activity, prices remain fairly close to an all-time high of $73,000. Additionally, price action is still positioned at a significant distance above the Moving Average (MA) indicator. Simultaneously, the Stochastic Relative Strength Index (Stochastic RSI) lines are seen rising steadily upward, with the leading line already above the 80 level of the indicator.
Bitcoin Price Prediction: BTC/USDT May Break the $73,000 Threshold
Price action in the BTC/USDT daily market remains below the $73,000 price level, yet indicators are suggesting the market may soon surpass this level. The movement in the Stochastic RSI, as mentioned above, indicates increased volatility, which appears favorable for the ongoing market trend.
Furthermore, Bitcoin now trades at a significant distance above the MA lines, effectively reducing the risk that the current session poses to price movement. As a result, the Bitcoin market remains positioned for continued upside movement.
Bitcoin Price Prediction: BTC/USDT Buyers Are Defending the $72,000 Threshold (4-Hour Chart)
In more recent trading sessions, Bitcoin’s 4-hour market shows price action holding above the $72,000 level. However, the market has not yet surpassed the $73,000 level as of this writing. Nevertheless, the price movement has remained supported above the $72,000 threshold, with the ongoing session printing a minimal upside retracement, bringing the market to the $72,457 price level.
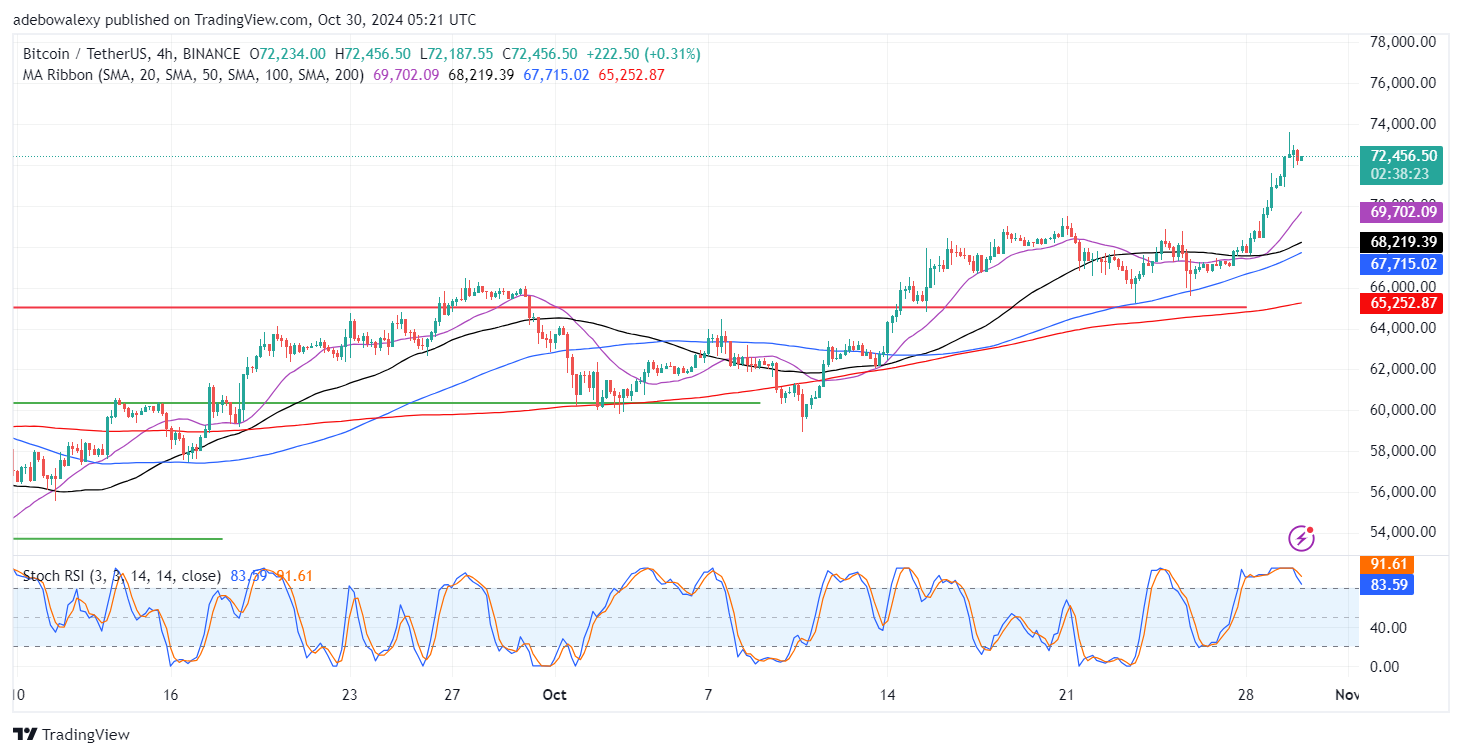
Trading activity is still situated above all MA lines and remains at a considerable distance. Meanwhile, the Stochastic RSI lines are moving downward toward the 80 level of the indicator. This appears somewhat contradictory to the current price trajectory, as the new session has shown a slight upside rebound. Consequently, it may be reasonable for traders to target the $74,000 price level for short-term profits.