BNB (BNB/USDT) Poised for Recovery Above Resistance After Recent Pullback
Estimated Reading Time: 4 minutes
Don’t invest unless you’re prepared to lose all the money you invest. This is a high-risk investment and you are unlikely to be protected if something goes wrong. Take 2 minutes to learn more
Over the last 24 hours, BNB against Tether has risen by 0.8%, slightly performing better than the broader crypto market, which was flat at +0.7%. As it stands, this price increase partially reversed its 7-day decline of 3.75%. To this end, analysts are pointing to a technical rebound, as the pair appears to be testing multi-month trend line support between $803 and $854.
In addition to the technical factors, the input from ecosystem development towards the growth of BNB can’t be overemphasized. This can be seen in the Ondo Finance tokenized stocks offering to Solana by the BNB Chain bridge and the institutional interest, as seen in Vaneck’s BNB filing progress.
Currently, BNB trades at $857.45, with more than 29,000 volumes at the time of writing.
Technical Indicators
Major Resistance Levels: $866, $953, and $1,150
Major Support Levels: $850, $774, and $700
Technical Analysis
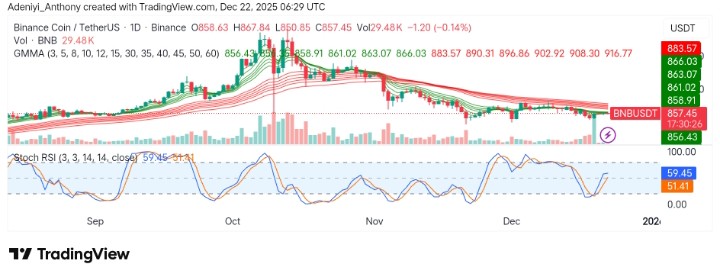
Technically, on the daily chart, BNB against Tether appears to be showing a strong sign of an impending uptrend while consolidating at the current level. However, the Guppy Multiple Moving Averages (GMMA) appears to be displaying mixed signals, with long-term moving averages still above short-term averages, but the price action around the short-period EMAs shows a potential for upward momentum if the support level holds.
From another angle, the Stochastic RSI shows that the market is in a neutral state, indicating that there is room for either a bullish breakout or a bearish reversal, depending on the price action. However, the direction of the indicator’s lines signals that there might be an extended consolidation phase.
To this end, if the pair can hold above $850, a move above $883 might materialize soon; otherwise, a downside movement toward $836 might be seen.
$BNB: As mentioned months ago, price entered my ideal zone for a local top and has reversed to the downside. It is now trading within the support area for a potential wave-4 low, with key support around $754.
My preferred scenario is one more high in wave-5 to complete the… pic.twitter.com/NVNDElXt2I— Man of Bitcoin (@Manofbitcoin) December 21, 2025
Meanwhile, @ManofBitcoin seems to have identified the current price of BNB as an ideal zone for a local top. As it stands, the analyst stated that the token is now trading within a support area that could mark the potential low of wave-4, with key support at $754. He further suggested that his preferred scenario involves one more upward movement in wave-5 to complete the current market structure.
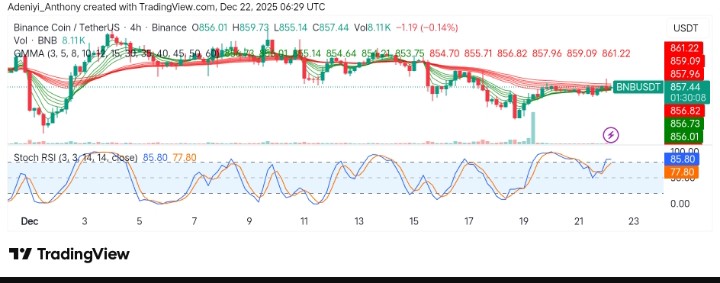
BNB/USDT Analysis: Waiting for Momentum?
On the 4-hour chart, BNB/USDT price action shows a range-bound market, with the price fluctuating between $856.01 and $861.22. The momentum oscillator suggests the market is overbought, signaling a possible retracement before another leg higher.
Meanwhile, the GMMA indicator on this chart shows that short-term moving averages are above the long-term averages, indicating a bullish short-term trend. However, the price action is facing resistance near $861.22.
To this end, if the price fails to break above this resistance, a correction towards $830 would resurface.
You can purchase crypto coins here. Buy Crypto