Chainlink (LINK/USDT) Consolidates Near $17.54 Critical Level
Estimated Reading Time: 3 minutes
Don’t invest unless you’re prepared to lose all the money you invest. This is a high-risk investment and you are unlikely to be protected if something goes wrong. Take 2 minutes to learn more

Chainlink Long-term Analysis: Bearish
The market sentiment for Chainlink against the Tether has remained cautious as the price faced a strong decline over the weeks. However, at some point the pair was on a strong uptrend for several months; it is now experiencing a retracement phase as the price ranges around $17.54.
Recently, the pair has been trending downward, as the Guppy Multiple Moving Averages (GMMAs) signal the pair is acting under strong selling pressure. However, the oversold condition of the Stochastic RSI could suggest that Chainlink may be due for a potential reversal.
Currently, Chainlink trades at $17.89 with over 20 million traded volumes for the week.
Technical Indicators
Major Resistance Levels: $18.67, $19.45, and $20.02
Major Support Levels: $17.54, $16.84, and $16.02
Chainlink Technical Analysis
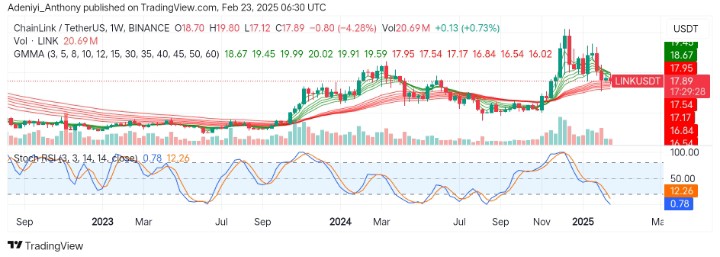
The weekly analysis of Chainlink against the Tether shows that the pair is at a crucial point, hovering between $18.70 and $17.54 levels as the technical indicators point to the south. The GMMAs signal a bearish crossover as the short-period EMAs point toward the long-period EMAs, suggesting a weakness in the bullish momentum.
On the other hand, the Stochastic oscillator indicates the pair is in the oversold region with the price reading 0.78 and 12.26 for blue and orange lines, respectively. On one side, this suggests strong sell-offs; on another, it could mean the pair is due for a reversal provided the bullish traders are ready to flood the market.
To this end, the price needs to stabilize above $17.54 for a break above $19.45 for a bullish reversal; otherwise, a fall below $17.50 would signal a continuation of the downtrend.
LINK/USDT Analysis: What’s Happening Here?
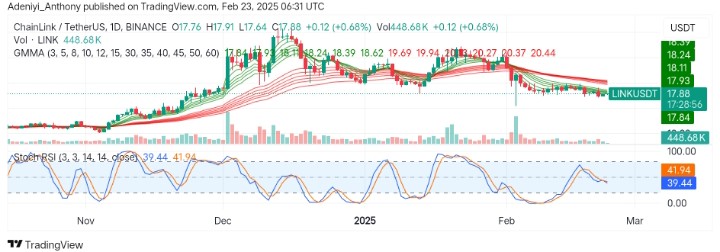
On the daily timeframe, LINK/USDT appears to be showing signs of stabilization as the pair records a minor gain of 0.68%, indicating bullish traders are entering the market. However, the GMMAs signal the bears still dominates, but with a sustained increase in bullish volume, a bullish crossover of the EMAs is expected to materialize soon.
On the other hand, the oscillator signals the pair lacks direction. However, as the lines are intertwined, a bullish attempt is expected with a bullish crossover; otherwise, a further price drop may be seen.
To this end, the volume of over 448 thousand seems relatively low; a shift in momentum would be seen if the price hit above $18.24 in the near term. Conversely, more downside could materialize if the price drops below $17.50.
You can purchase crypto coins here. Buy LBlock